


In this interesting medium article, RTC veteran Vittorio Palmisano shows his audience how to simplify the debugging process of WebRTC applications by exporting all RTCPeerConnections metrics generated by Browser sessions out to a Prometheus + PushGateway service using a custom built browser extension.
If you have Prometheus and PushGateway up, that's great. If you don't.....
This is exactly the challenge we designed qryn for - so you know what's next!

Requirements
In order to run this experiment you will need the following:
qryn or qryn.cloud setup to ingest and query metrics
grafana to display metrics using the included dashboard
chrome browser with our custom extension installed
Browser Extension Exporter
For this demo, we'll keep things simple. The original article requires a PushGateway to deliver the Prometheus metrics. The InfluxDB line protocol is a valid alternative candidate for the job, allowing direct delivery to a collector such as qryn without extra components, so we modified the extension to add this protocol method.
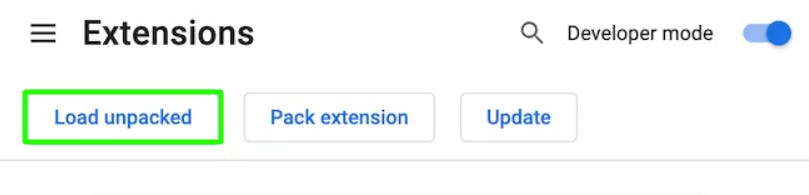
👉 Download and manually install our extension from our GitHub repository
Once installed, you need to visit the extension options page, filling the qryn endpoint and optional username/password. Other optional settings include:
Update interval: it allows to change the metrics collection interval (in seconds).
Enabling gzip compression: it is not required but recommended in order to reduce the amount of data sent over the network;
Job name: it allows to customize the
joblabel attached to each metric. Usually, you can query the exported label in Grafana using theexported_joblabel selector.Enabled PeerConnection stats: you can specify here the list metrics types that you want to collect from the
getStatsoutput.Enabled URL origins: you can see here the list of allowed URLs where the extension will actually collect data.
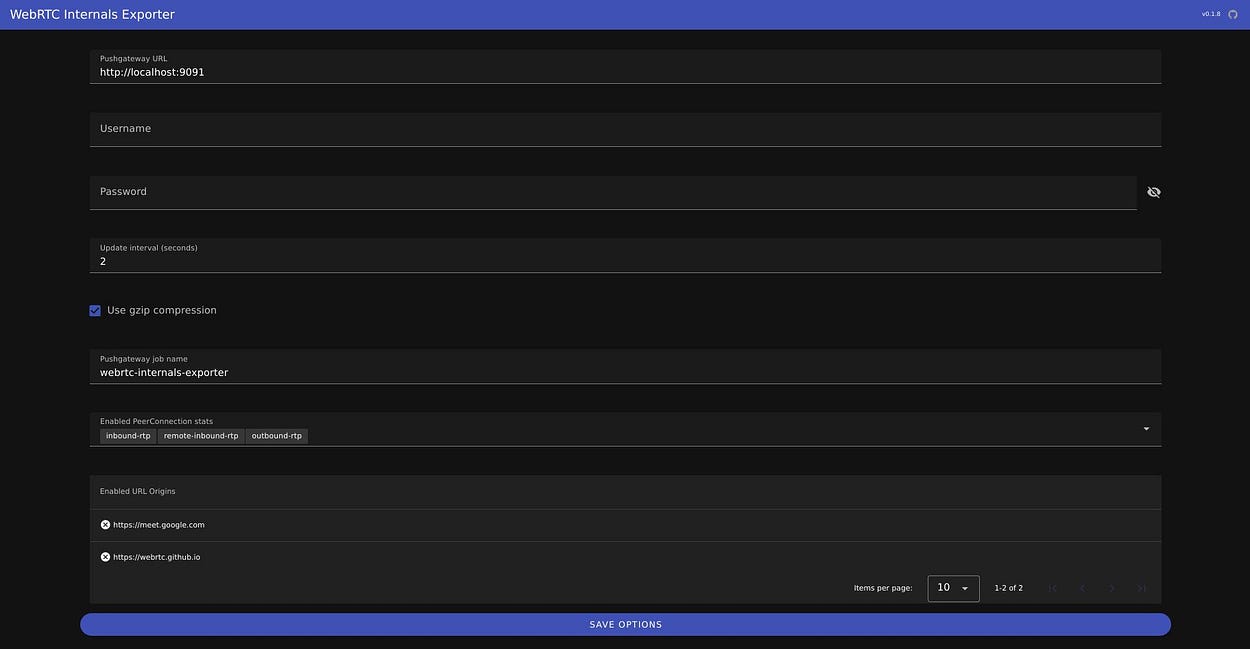
For a local qryn setup, you will only need the URL parameter: qryn:3100
Save your settings and proceed ahead.
Talk to Yourself
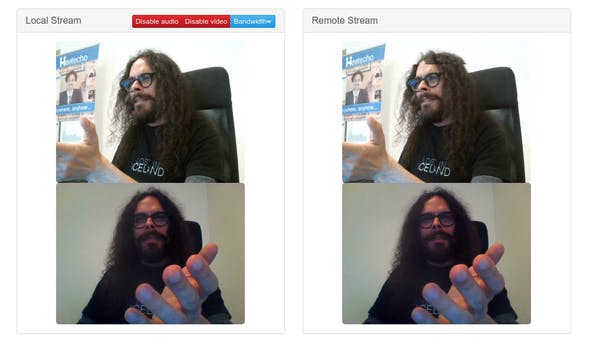
Real WebRTC developer and testers always prefer talking to themselves.
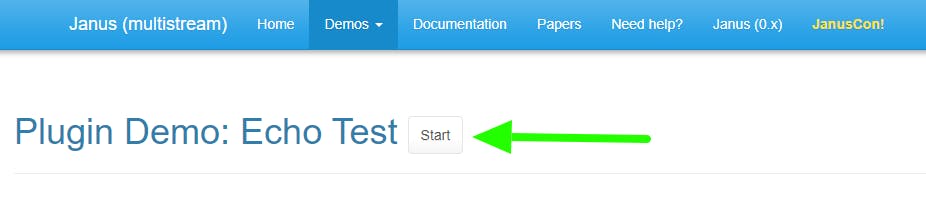
To join the club, open your Chrome browser and start the Janus Echo Test
Enable the WebRTC Internals Exporter for the Janus website 👇👇👇
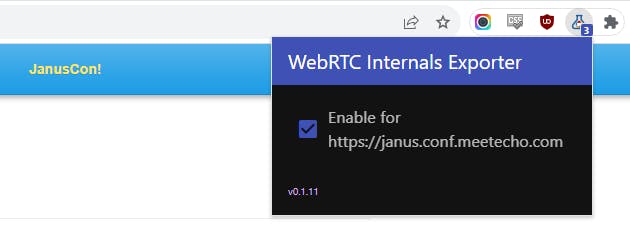
Click start to initiate your WebRTC echo session and begin producing statistics
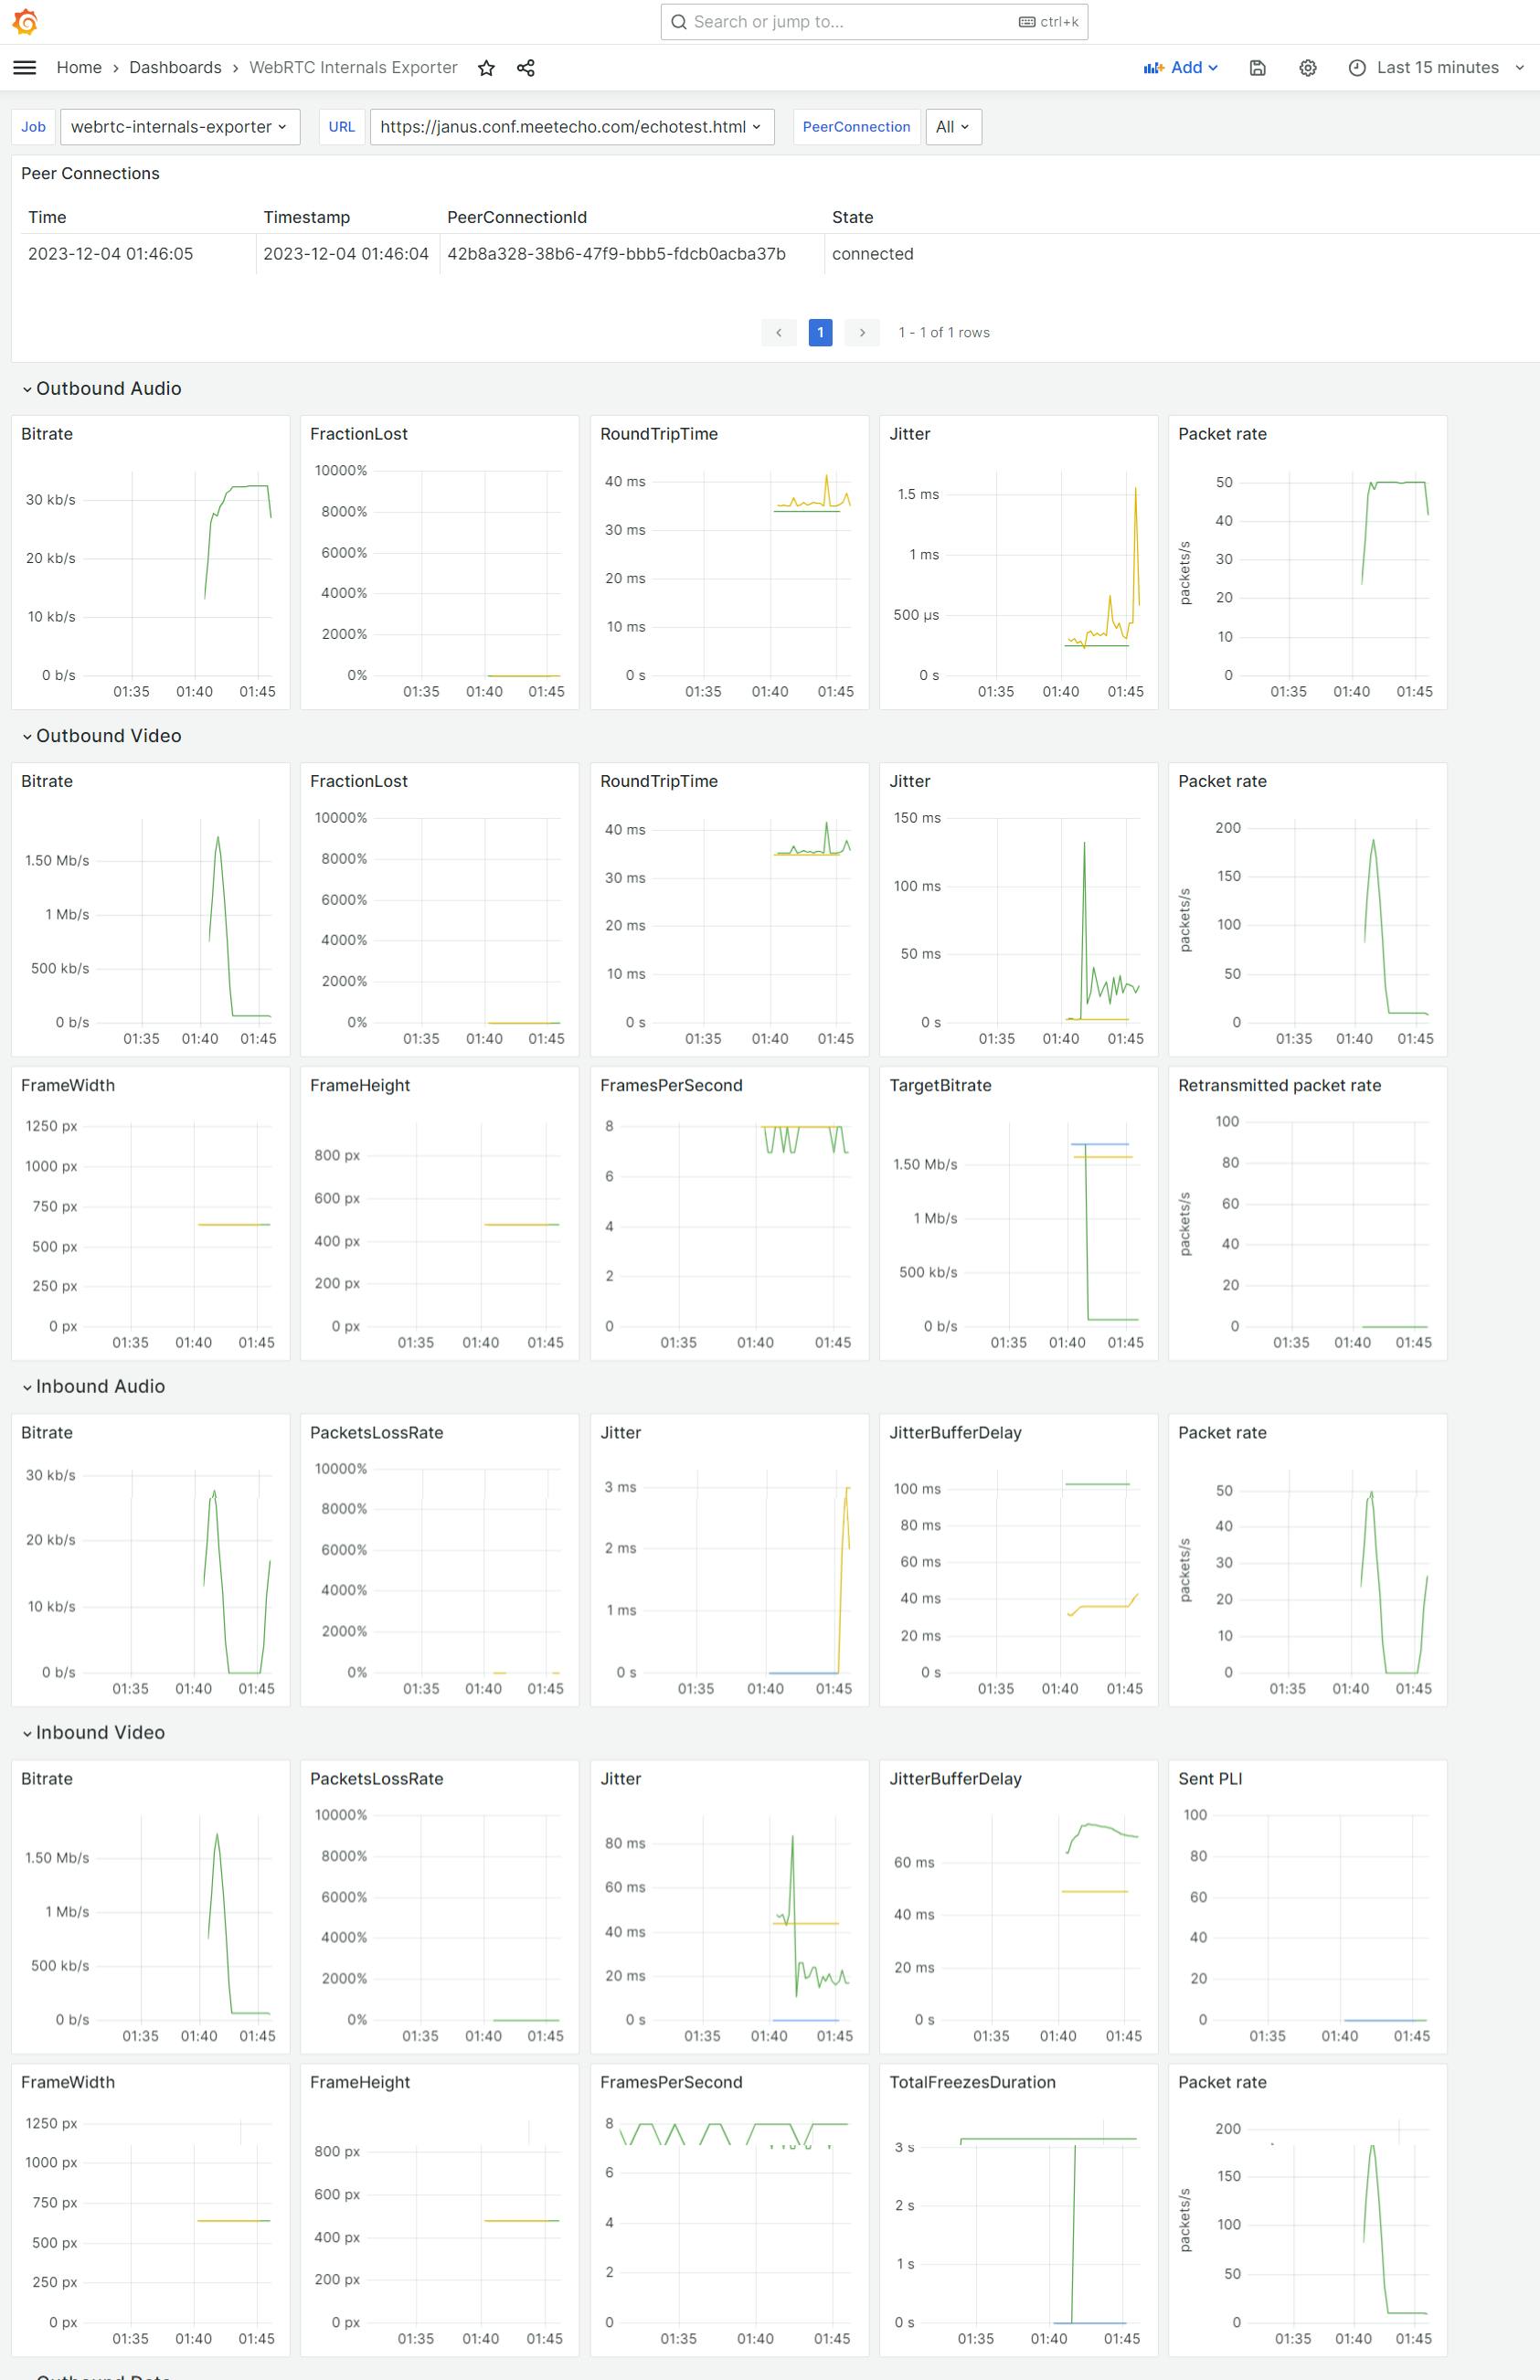
📈 Real Time Analytics
If you followed each step and bad luck didn't get in the way, our metrics should be inserted into qryn and available through the Prometheus API. All of our data points and tags are instantly available on the imported preset WebRTC Dashboard 👈
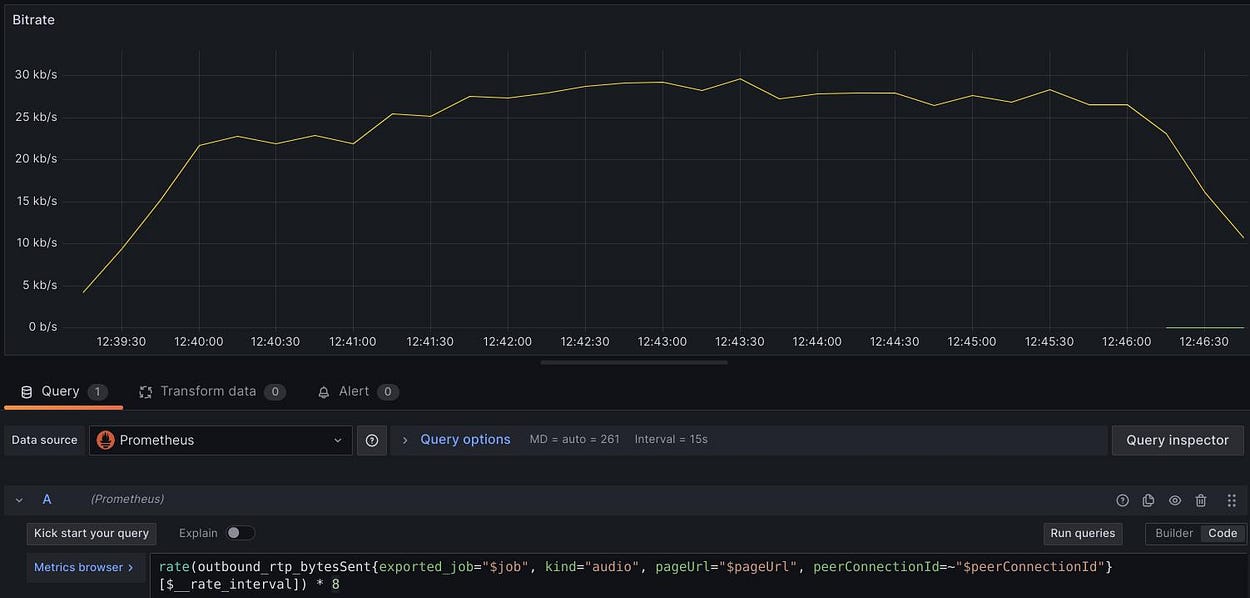
The extension will convert each numeric value found in the
RTCPeerConnectionsstats using a Gauge metric type, using the remaining string properties as labels. E.g. the bytesSent value in the outbound-rtp stats will be converted to a metric named outbound_rtp_bytesSent using the remaining string properties as labels.
Just imagine the combination of these reports with serverside Janus Events.....
Conclusion
That's it! With the power of opensource you have added a powerful asset to your real-time communications troubleshooting toolbox, while enjoying the polyglot capabilities of qryn alongside other RTC integrations such as homer and hepic.
Let's get polyglot 💛