


Synthetic testing holds a crucial role in the Observability toolbox, serving various purposes such as assessing application SLAs, tracking endpoint performance across diverse geographic regions, simulating user interactions with web applications, and proactively spotting post-deployment issues before they impact end-users.
As always, the Opentelemetry community leads by example and recently released HTTP Check Receiver, a vendor-agnostic toolset for their popular collector.
In the v0.63.0 release, the OTel Collector added support for synthetic HTTP checks via a receiver called the HTTP Check Receiver. This component sends a request via HTTP or HTTPS and produces metrics to capture the duration of the request and record the returned status code. You can now deploy an agent to your preferred environment to test public OR private endpoints without the need to whitelist IPs in your firewall and transfer the tests between your preferred destination like any other piece of OTel data.
HTTPCheck with qryn
If you already have an existing qryn setup or a qryn.cloud account, you can instantly leverage this receiver or add it to your existing open telemetry pipelines.
Here's an example recipe for sending collected httpcheck metrics to qryn using our Clickhouse otel-contrib or qryn.cloud using built-in Prometheus remote_write.
ClickHouse Exporter for qryn.dev
Here's how to use the HTTP Check with qryn-otel ClickHouse driver:
receivers:
  httpcheck:
    targets:
      - endpoint: https://api.restful-api.dev/objects
        method: GET
      - endpoint: https://httpbin.org/delete
        method: DELETE
      - endpoint: https://httpbin.org/post
        method: POST
        headers:
          test-key: 'test-123'
    collection_interval: 10s

exporters:
  qryn:
    dsn: tcp://clickhouse-server:9000/cloki?username=default&password=*************
    timeout: 10s
    sending_queue:
      queue_size: 100
    retry_on_failure:
      enabled: true
      initial_interval: 5s
      max_interval: 30s
      max_elapsed_time: 300s
    logs:
       format: raw
processors:
  batch:

service:
  pipelines:
    metrics:
      receivers: [httpcheck]
      processors: [batch]
      exporters: [qryn]
Prometheus Exporter for qryn.cloud
With qryn.cloud we can simply use the stock otel/opentelemetry-collector-contrib and a Prometheus remote_write exporter pointed at your qryn.cloud endpoint:
receivers:
  httpcheck:
    targets:
      - endpoint: https://api.restful-api.dev/objects
        method: GET
      - endpoint: https://httpbin.org/delete
        method: DELETE
      - endpoint: https://httpbin.org/post
        method: POST
        headers:
          test-key: 'test-123'
    collection_interval: 10s

exporters:
  prometheusremotewrite:
    endpoint: "https://qryn.gigapipe.com/api/v1/prom/remote/write"
    headers:
      X-API-Key: your-qryn-cloud-api-key
      X-API-Secret: your-qryn-cloud-api-secret
    resource_to_telemetry_conversion:
      enabled: true

processors:
  batch:

service:
  pipelines:
    metrics:
      receivers: [httpcheck]
      processors: [batch]
      exporters: [prometheusremotewrite]
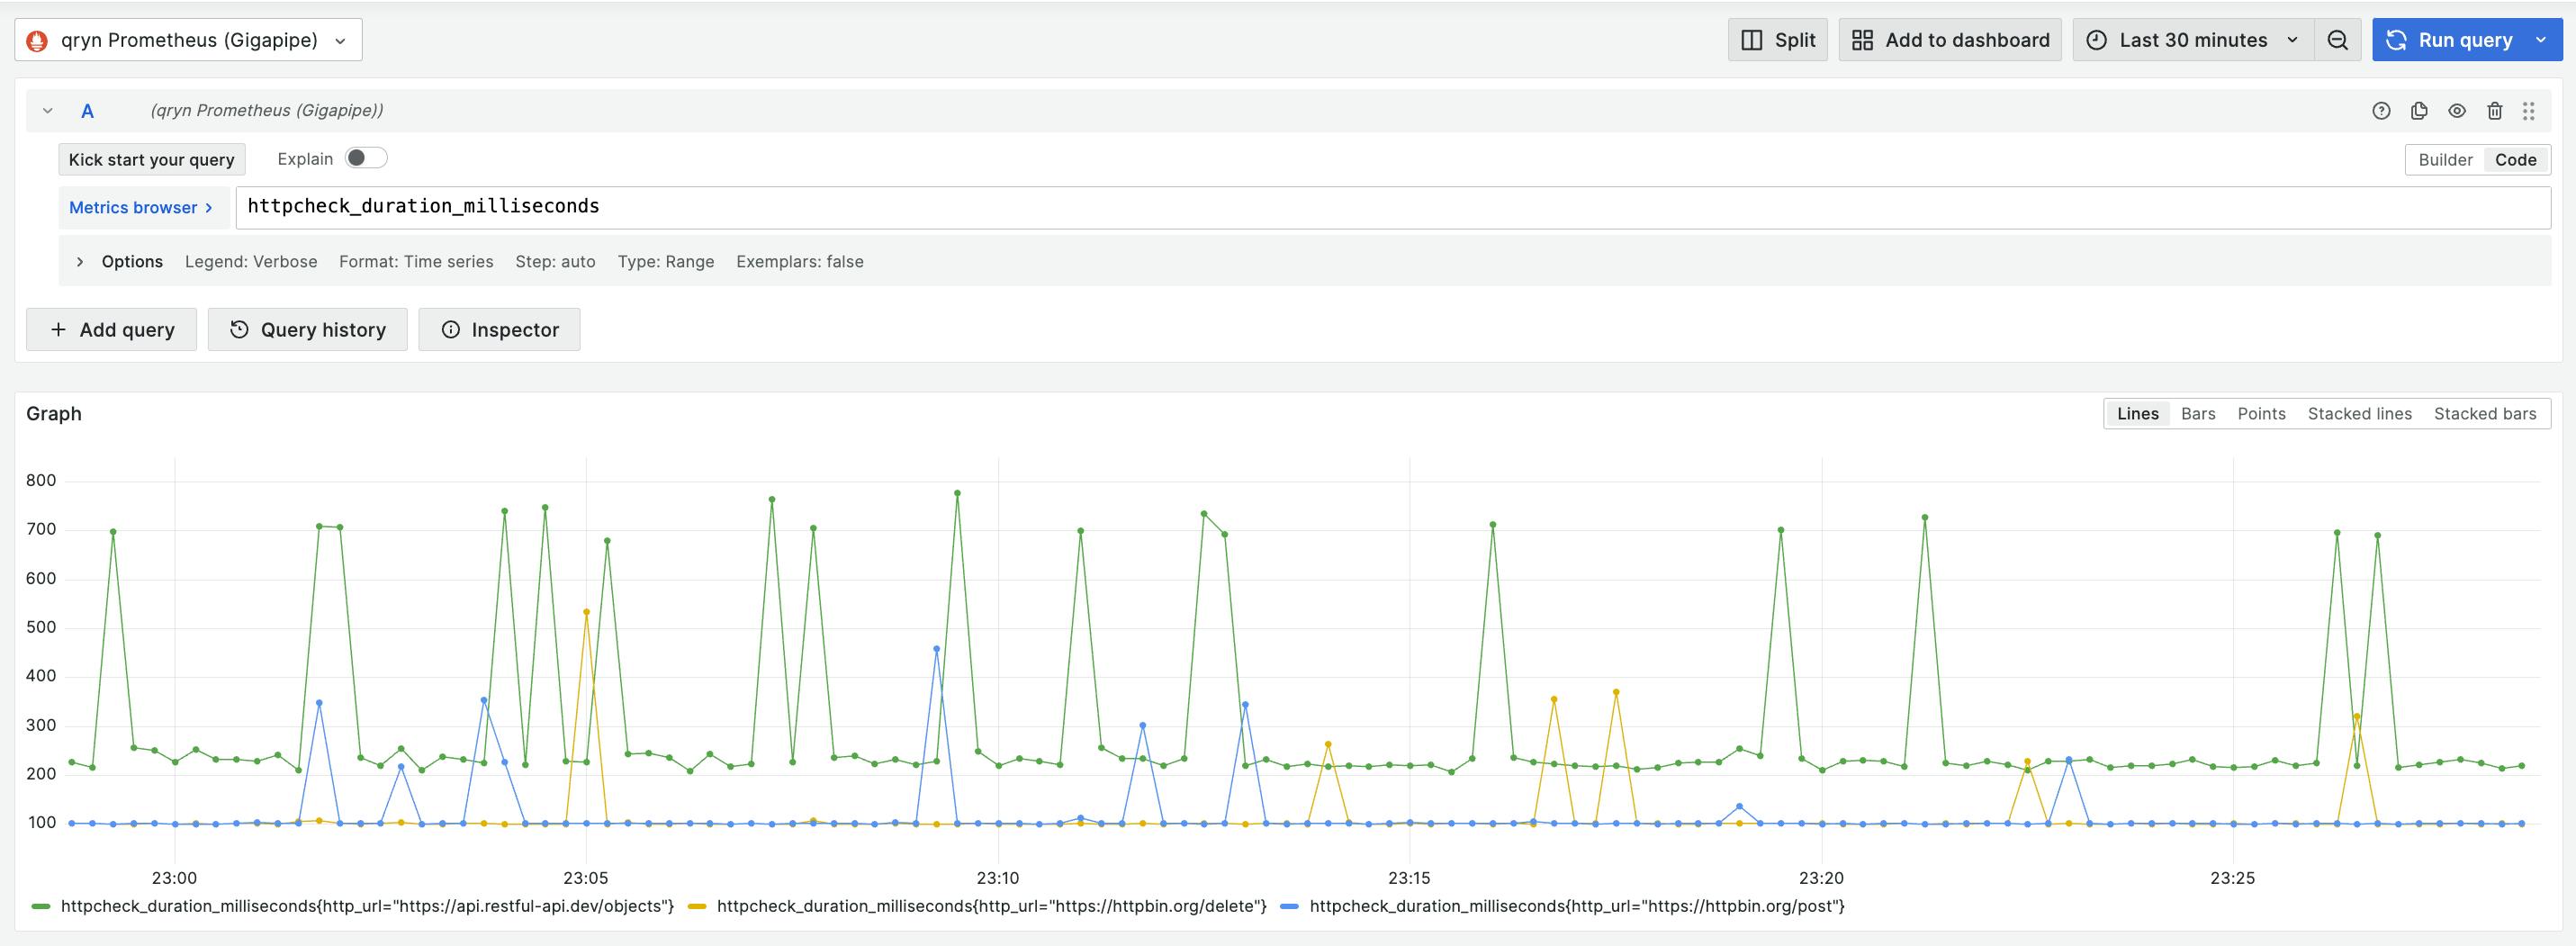
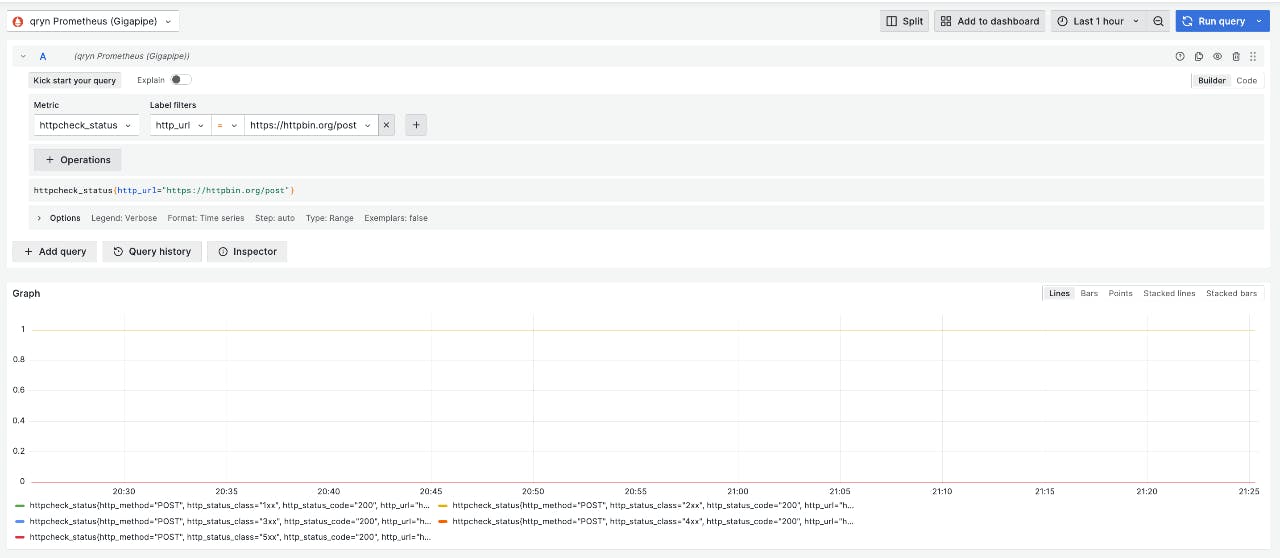
The HTTPCheck receiver generates the following metrics:
httpcheck.duration
httpcheck.status
httpcheck.error
You can instantly browse data using the qryn prometheus compatible features:
Here's a full docker compose recipe you can copy-paste into action
That's it. Everything is simple when you don't have to worry about protocols!