


Grafana just announced Alloy a new flexible, high performance, vendor-neutral distribution of the Opentelemetry (OTel) Collector. Since Alloy is compatible with the most popular open source observability standards such as Opentelemetry, Prometheus and Loki - it is also fully compatible our of the box with qryn!
That's our polyglot magic making Observability less of a pain for everyone!
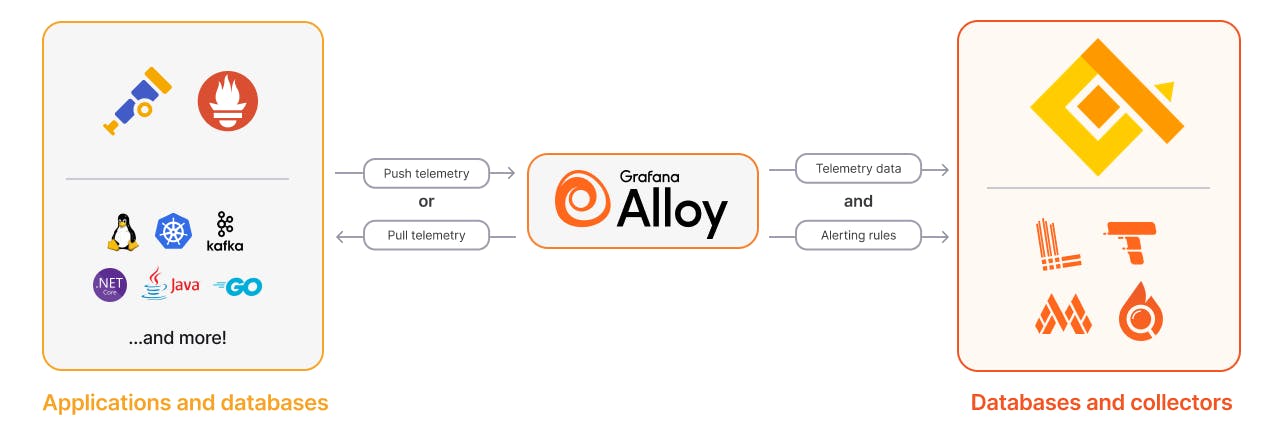
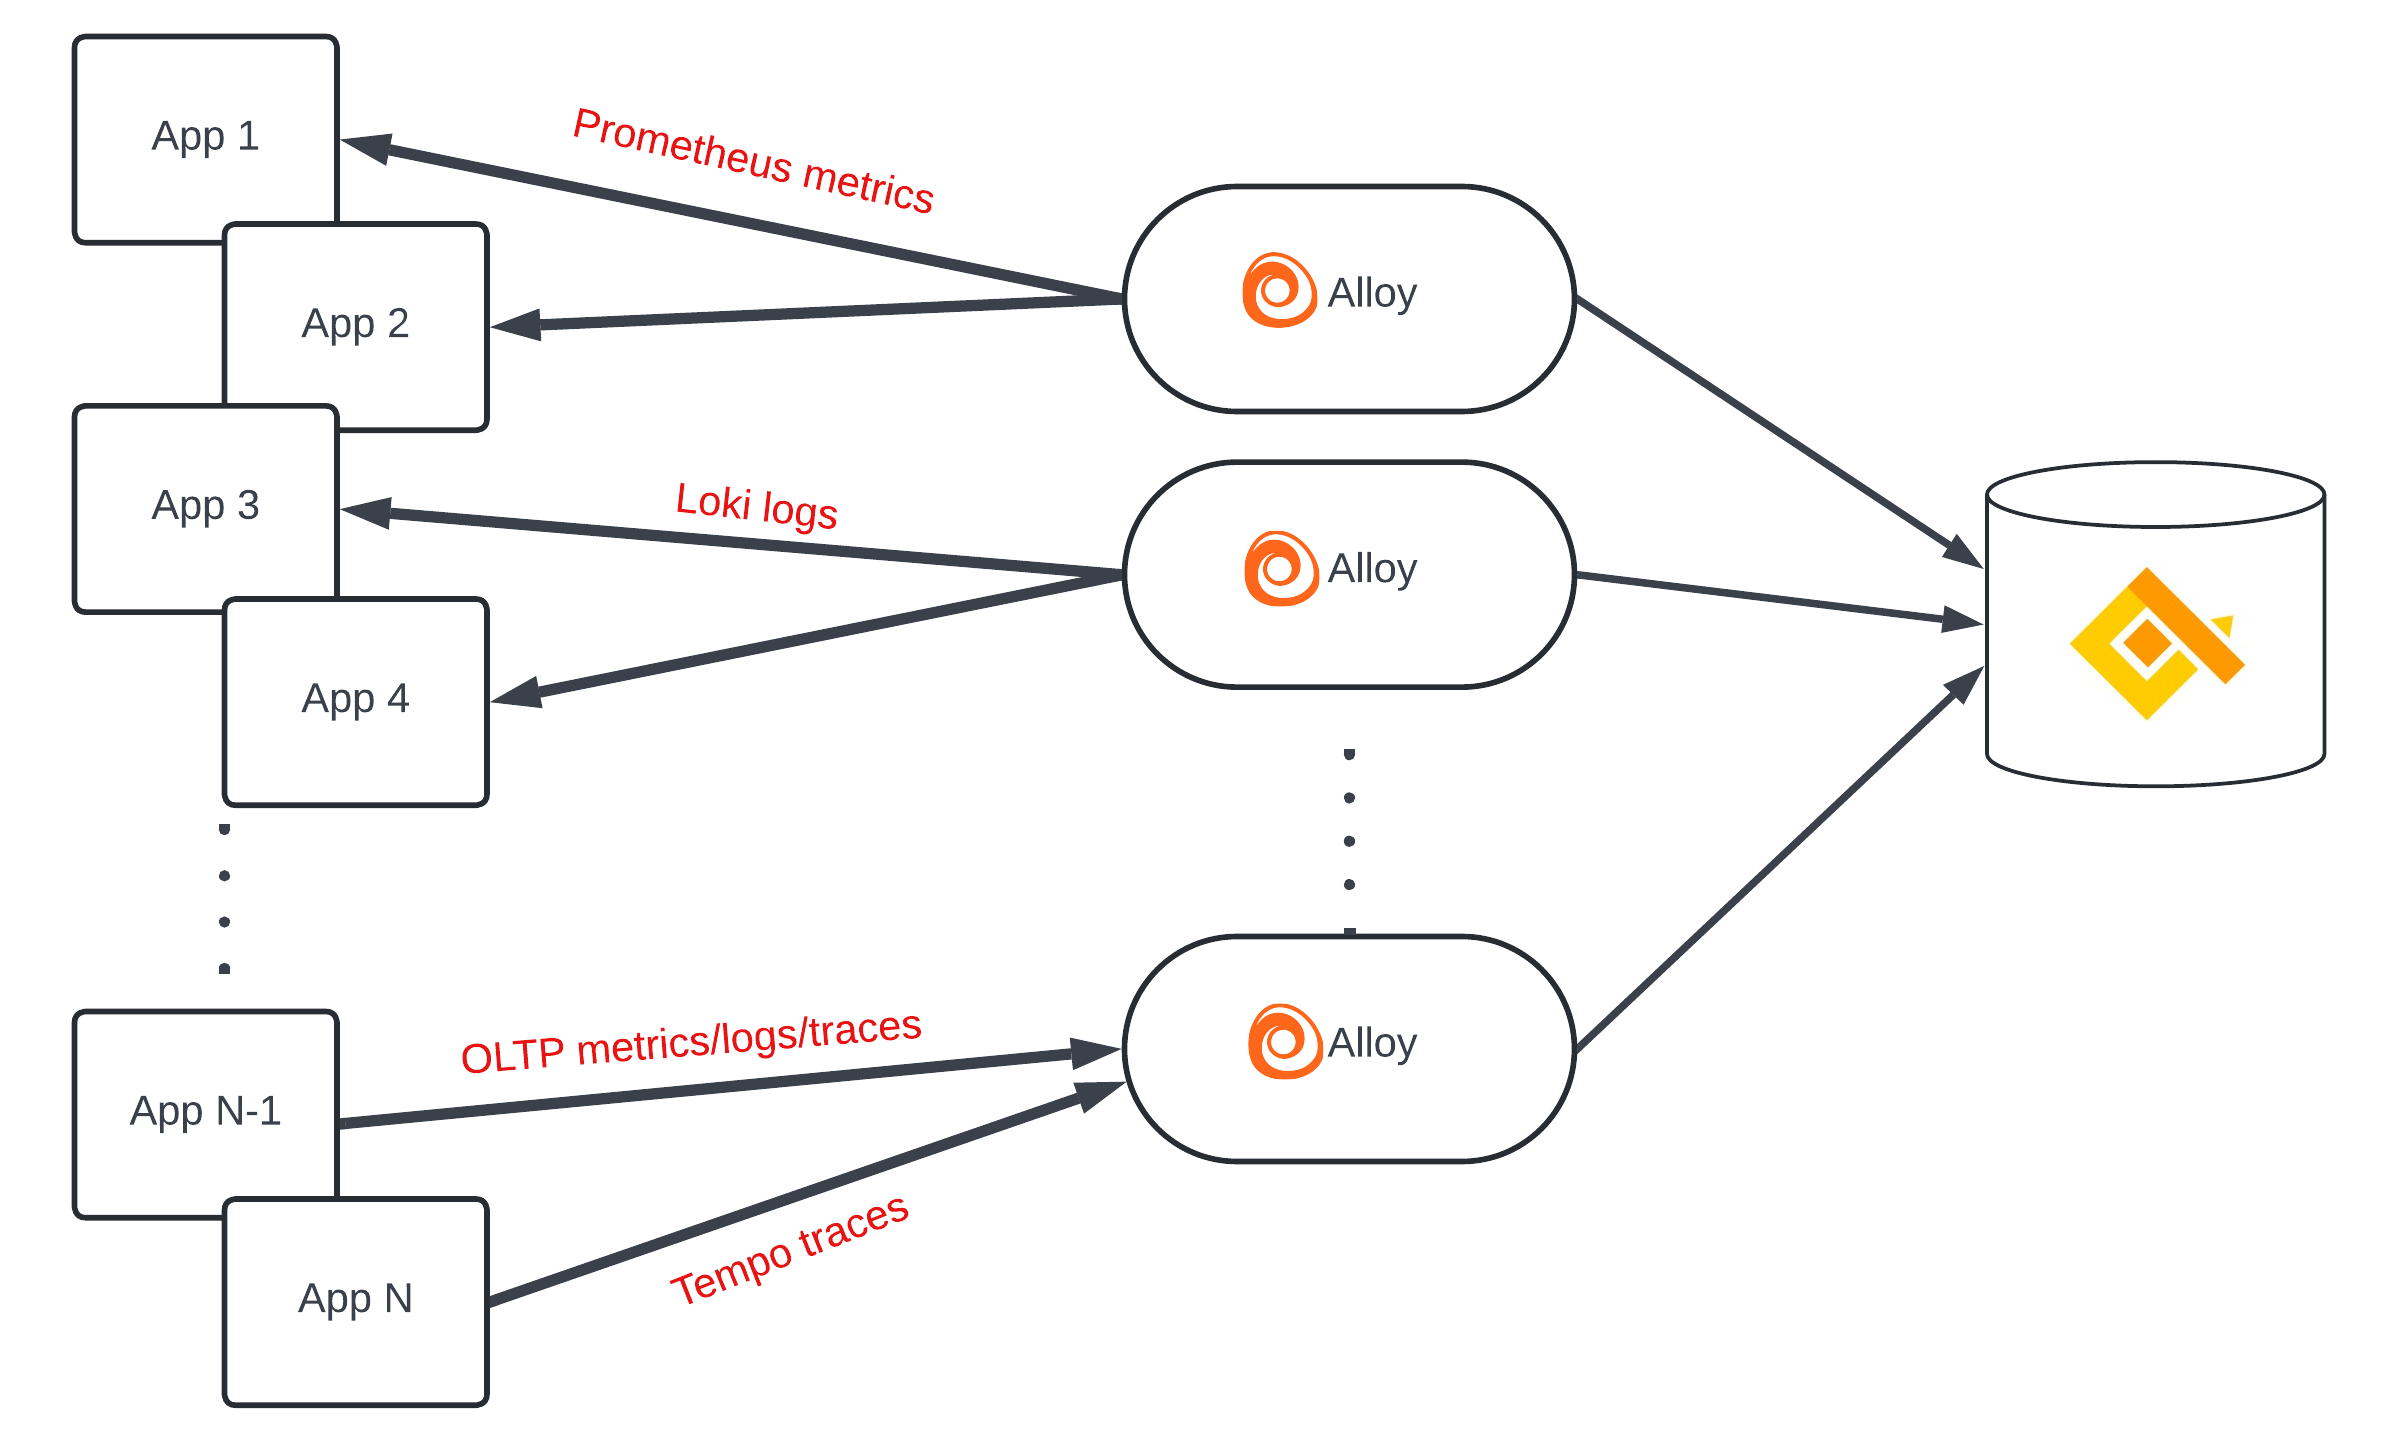
Alloy is a vendor-neutral telemetry collector. This means that Alloy doesn’t enforce a specific deployment topology but can work in multiple scenarios acting as a metrics scraper, logs scraper, Opentelemetry receiver and more - with dynamic routing.
💦 The Alloy Pipeline
Just like most collectors, Alloy offers its functionality in different stages:
1) Collect
Alloy uses more than 120 components to collect telemetry data from applications, databases, and Opentelemetry collectors. Alloy supports collection using multiple ecosystems, including Opentelemetry and Prometheus. Telemetry data can be either pushed to Alloy, or Alloy can pull it (scrape) from your data sources.
2) Transform
Alloy processes data and transforms it for sending. You can use transformations to inject extra metadata into telemetry or filter out unwanted data.
3) Write
Alloy sends data to Opentelemetry-compatible databases or collectors such as Grafana LGTM or qryn. Alloy can also write alerting rules in compatible databases.
⚙️ Installation
Installi Alloy on your system following the official documentation
Run a Linux Docker container
To run Alloy examples in Docker use the following command in a terminal:
docker run \
  -v <CONFIG_FILE_PATH>:/etc/alloy/config.alloy \
  -p 12345:12345 \
  grafana/alloy:latest \
    run --server.http.listen-addr=0.0.0.0:12345 --storage.path=/var/lib/alloy/data \
    /etc/alloy/config.alloy
Replace the following:
<CONFIG_FILE_PATH>: The path of the configuration file on your host system.
⚠️ Data collection ⚠️
By default, Grafana Alloy sends anonymous (but uniquely identifiable) usage information from your Alloy instance to Grafana Labs. Use the -disable-reporting command line flag to disable the reporting and opt-out from this annoyance.
⚙️ Alloy Examples for qryn
Here are some generic observability examples combining Alloy and qryn:
🔶 Prometheus Scraper
Scrape Prometheus Metrics and forward them to qryn for ingestion
prometheus.scrape "prometheus" {
  targets = [{
    __address__ = "localhost:12345",
  }]
  forward_to     = [prometheus.remote_write.default.receiver]
  job_name       = "prometheus"
  scrape_timeout = "45s"
}

prometheus.remote_write "default" {
  endpoint {
    name = "qryn"
    url  = "https://qryn:3100/api/prom/push"

    basic_auth {
      username = "USERNAME"
      password = "PASSWORD"
    }

    queue_config {
      capacity             = 2500
      max_shards           = 200
      max_samples_per_send = 500
    }

    metadata_config {
      max_samples_per_send = 500
    }
  }
}
🔶 Log Scraper
Scrape Logs from any system and forward them to qryn for ingestion
local.file_match "example" {
    path_targets = [{
        __address__ = "localhost",
        __path__    = "/var/log/*.log",
    }]
}

loki.source.file "example" {
    targets    = local.file_match.example.targets
    forward_to = [loki.write.default.receiver]
}

loki.write "default" {
    endpoint {
        url = "http://qryn:3100/loki/api/v1/push"
    }
    external_labels = {}
}
🔶 OTel Collector for qryn
Collect and Forward Opentelemetry protocols to qryn
otelcol.receiver.otlp "default" {
    grpc { }

    http { }

    output {
        metrics = [otelcol.processor.memory_limiter.default.input]
        logs    = [otelcol.processor.memory_limiter.default.input]
        traces  = [otelcol.processor.memory_limiter.default.input]
    }
}

otelcol.processor.memory_limiter "default" {
    check_interval   = "1s"
    limit_percentage = 90

    output {
        metrics = [otelcol.exporter.otlp.default.input]
        logs    = [otelcol.exporter.otlp.default.input]
        traces  = [otelcol.exporter.otlp.default.input]
    }
}

otelcol.exporter.otlp "default" {
    client {
        endpoint = "qryn:3100"
    }
}
🔶 Tempo Collector with Service Graph
otelcol.receiver.otlp "default" {
  grpc {
    endpoint = "0.0.0.0:4320"
  }

  output {
    traces  = [otelcol.connector.servicegraph.default.input,otelcol.exporter.otlp.qryn_tempo.input]
  }
}

otelcol.connector.servicegraph "default" {
  dimensions = ["http.method"]
  output {
    metrics = [otelcol.exporter.prometheus.default.input]
  }
}

otelcol.exporter.prometheus "default" {
  forward_to = [prometheus.remote_write.qryn.receiver]
}

prometheus.remote_write "qryn" {
  endpoint {
    url = "https://qryn:3100/api/prom/push"

    basic_auth {
      username = env("QRYN_USERNAME")
      password = env("QRYN_PASSWORD")
    }
  }
}

otelcol.exporter.otlp "qryn_tempo" {
  client {
    endpoint = "https://qryn:3100"
    auth     = otelcol.auth.basic.qryn_tempo.handler
  }
}

otelcol.auth.basic "qryn_tempo" {
  username = env("QRYN_USERNAME")
  password = env("QRYN_PASSWORD")
}
🔶 K8s Operator for qryn
// read the credentials secret for remote_write authorization
remote.kubernetes.secret "credentials" {
  namespace = "monitoring"
  name = "primary-credentials-metrics"
}

prometheus.remote_write "primary" {
    endpoint {
        url = "https://qryn:3100/api/v1/push"
        basic_auth {
            username = nonsensitive(remote.kubernetes.secret.credentials.data["username"])
            password = remote.kubernetes.secret.credentials.data["password"]
        }
    }
}

prometheus.operator.podmonitors "primary" {
    forward_to = [prometheus.remote_write.primary.receiver]
    // leave out selector to find all podmonitors in the entire cluster
    selector {
        match_labels = {instance = "primary"}
    }
}

prometheus.operator.servicemonitors "primary" {
    forward_to = [prometheus.remote_write.primary.receiver]
    // leave out selector to find all servicemonitors in the entire cluster
    selector {
        match_labels = {instance = "primary"}
    }
}
🔶 K8s Pods Scraper for qryn
// Get our API key from disk.
//
// This component has an exported field called "content", holding the content
// of the file.
//
// local.file.api_key will watch the file and update its exports any time the
// file changes.
local.file "api_key" {
  filename  = "/var/data/secrets/api-key"

  // Mark this file as sensitive to prevent its value from being shown in the
  // UI.
  is_secret = true
}

// Create a prometheus.remote_write component, which other components can send
// metrics to.
//
// This component exports a "receiver" value, which can be used by other
// components to send metrics.
prometheus.remote_write "prod" {
  endpoint {
    url = "https://qryn:3100/api/v1/write"

    basic_auth {
      username = "admin"

      // Use the password file to authenticate with the production database.
      password = local.file.api_key.content
    }
  }
}

// Find Kubernetes pods where we can collect metrics.
//
// This component exports a "targets" value, which contains the list of
// discovered pods.
discovery.kubernetes "pods" {
  role = "pod"
}

// Collect metrics from Kubernetes pods and send them to prod.
prometheus.scrape "default" {
  targets    = discovery.kubernetes.pods.targets
  forward_to = [prometheus.remote_write.prod.receiver]
}
🔶 Loki + Prometheus forwarder to qryn
prometheus.scrape "metrics_test_local_agent" {
    targets = [{
        __address__ = "127.0.0.1:12345",
        cluster     = "localhost",
    }]
    forward_to      = [prometheus.remote_write.metrics_test.receiver]
    job_name        = "local-agent"
    scrape_interval = "15s"
}

prometheus.remote_write "metrics_test" {
    endpoint {
        name = "qryn"
        url  = "https://qryn:3100/api/prom/push"

        basic_auth {
            username = "<USERNAME>"
            password = "<PASSWORD>"
        }

        queue_config { }

        metadata_config { }
    }
}

local.file_match "logs_varlogs_varlogs" {
    path_targets = [{
        __address__ = "localhost",
        __path__    = "/var/log/*.log",
        host        = "mylocalhost",
        job         = "varlogs",
    }]
}

loki.process "logs_varlogs_varlogs" {
    forward_to = [loki.write.logs_varlogs.receiver]

    stage.match {
        selector = "{filename=\"/var/log/*.log\"}"

        stage.drop {
            expression = "^[^0-9]{4}"
        }

        stage.regex {
            expression = "^(?P<timestamp>\\d{4}/\\d{2}/\\d{2} \\d{2}:\\d{2}:\\d{2}) \\[(?P<level>[[:alpha:]]+)\\] (?:\\d+)\\#(?:\\d+): \\*(?:\\d+) (?P<message>.+)$"
        }

        stage.pack {
            labels           = ["level"]
            ingest_timestamp = false
        }
    }
}

loki.source.file "logs_varlogs_varlogs" {
    targets    = local.file_match.logs_varlogs_varlogs.targets
    forward_to = [loki.process.logs_varlogs_varlogs.receiver]

    file_watch {
        min_poll_frequency = "1s"
        max_poll_frequency = "5s"
    }
}

loki.write "logs_varlogs" {
    endpoint {
        url = "https://qryn:3100/loki/api/v1/push"
    }
    external_labels = {}
}
There's so much more you can do with alloy and qryn combined integration. Let us know your ideas, feedback and experience through our Github repository.
🔶 Get Polyglot
qryn is the observability system you've been waiting for - its free and opensource
Logs, Metrics, Traces, Continuous Profiling. All of the power, none of the stress!