


Grafana Scenes is a new front-end library that enables developers to create dashboard-like experiences — such as querying and transformations, dynamic panel rendering, and time ranges — directly within Grafana application plugins.
Scenes are collections of objects representing different UI components, such as data, time ranges, variables, layout, and visualizations. Let's see how we can use them to build a Log-centric Scene using a qryn Loki compatible data source.
Let's make a Scene
Let's begin our journey by exploring the Apps item in the left-side menu.
The boilerplate Scenes app comes with three routes: Page with tabs, Page with drilldown, and Hello world. We’re going to focus on the Home route located in src/pages/Home.tsx and rendered as the default page of our new app plugin.
The most important objects in a Grafana Scene are:
SceneApp: Responsible for top-level pages routing.scene.Component: Used in render functions to render yourSceneApp.
Let's begin by customizing the title and subtitle of our new Log Scenes App

We will include a verification for the existence of a qryn Loki data source and make sure to show a notification if it is missing. This will help avoid unforeseen errors and confirm that our setup is prepared for developing our new application.
import { DataSourceInstanceSettings } from '@grafana/data';

function hasLoggingDataSources(dataSources: Record<string, DataSourceInstanceSettings>) {
     return Object.entries(dataSources).some(([_, ds]) => ds.type === 'loki');
}
Once done, proceed updating your HomePage component.
export const HomePage = () => {
    const scene = useMemo(() => getScene(), []);
    const hasDataSources = useMemo(() => hasLoggingDataSources(config.datasources), []);

    return (
        <>
            {!hasDataSources && (
            <Alert title={`Missing logging data sources`}>
                    This plugin requires a Loki data source. Please add and configure a Loki data source to your Grafana instance.
            </Alert>
            )}
            <scene.Component model={scene} />
        </>
    );
};
If your local environment is configured correctly, you should not see any alerts.
Scenes for a Loki app
In this step, our focus will be on the file located in src/pages/Home/scenes.tsx.
In this file, we export the getBasicScene() function which will be used in the SceneAppPage on the Home page. To start, we need to consider the importance of time. Every request we make requires time, and for this application, we need a specific time interval to retrieve the data stored in qryn within that range.
The SceneTimeRange component manages the selection of time for query requests, and it is used in the SceneTimePicker control. In our example, we will create an instance that represents the time between now and one hour before. However, this range can be customized according to your needs. You don't have to worry about the fixed value, as we will allow the user to customize their selection.
import { SceneTimeRange } from '@grafana/scenes';

const timeRange = new SceneTimeRange({
    from: 'now-1h',
    to: 'now',
  });
User input is our next goal. To achieve this, we will utilize various controls that generate variables. Each variable will have a specific name and value. The DataSourceVariable enables the user to choose a data source from the ones configured in this Grafana instance. Once a data source is selected, a variable is generated. This variable possesses a designated name and can be utilized in queries and other components.
import { DataSourceVariable } from '@grafana/scenes';

const dsHandler = new DataSourceVariable({
    label: 'Data source',
    name: 'ds', // being $ds the name of the variable holding UID value of the selected data source
    pluginId: 'loki'
  });
QueryVariable enables you to showcase the outcomes of a query-based collection of values, like metric names or server names, in a dropdown menu. In this instance, we will request our qryn datasource to return the names of the stream selectors.
import { QueryVariable } from '@grafana/scenes';

const streamHandler = new QueryVariable({
    label: 'Source stream',
    name: 'stream_name', // $stream_name will hold the selected stream
    datasource: {
          type: 'loki',
          uid: '$ds' // here the value of $ds selected in the DataSourceVariable will be interpolated.
    },
    query: 'label_names()',
  });
TextBoxVariableis an input to enter free text. We will use it to select the value of the selected stream.
import { TextBoxVariable } from '@grafana/scenes';
const streamValueHandler = new TextBoxVariable({
    label: 'Stream value',
    name: 'stream_value', // $stream_value will hold the user input
  });
We currently have time and user input stored in our variables. Moving forward, we will utilize both the time and user input to construct queries. This is where the scene component comes into play. The SceneQueryRunner will retrieve data from the qryn Loki data source and deliver the results to a visualization or multiple visualizations.
Each query is represented as a JSON object, containing a reference ID (refid) and an expression that specifies the query to be executed.
import { SceneQueryRunner } from '@grafana/scenes';

const queryRunner = new SceneQueryRunner({
    datasource: {
          type: 'loki',
          uid: '$ds' // here the value of $ds selected in the DataSourceVariable will be interpolated.
    },
    queries: [
        {
            refId: 'A',
            expr: 'your query here',
        },
    ],
});
Visualizing Data
The PanelBuilders API provides support for building visualization objects for the supported visualization types, such as Stat, TimeSeries, and Logs.
1. Stat panel
We will begin by creating a stat visualization. Stats display a single prominent value along with an optional graph sparkline. You have the ability to customize the background or value color using thresholds or overrides. To achieve this, we will utilize a QueryRunner and a PanelBuilder.
To gather the necessary data, we will employ a qryn metric query to visualize the rate at which these logs occur within the specified time frame.
import { SceneQueryRunner, PanelBuilders } from '@grafana/scenes';
import { BigValueGraphMode } from '@grafana/schema';

const statQueryRunner = new SceneQueryRunner({
    datasource: {
        type: 'loki',
        uid: '$ds'
    },
    queries: [
        {
            refId: 'A',
            expr: 'sum(rate({$stream_name="$stream_value"} [$__auto]))',
        },
    ],
});

const statPanel = PanelBuilders.stat()
    .setTitle('Logs rate / second')
    .setData(statQueryRunner)
    .setOption('graphMode', BigValueGraphMode.None)
    .setOption('reduceOptions', {
         values: false,
         calcs: ['mean'],
         fields: '',
    });
Like we mentioned earlier, variables are going to be replaced with user input:
sum(rate({$stream_name="$stream_value"} [$__interval]))
Here's our Panel's logic explained as a sequence:
Request a
StatfromPanelBuilder.Provide a title.
Tell it where to get the data.
Tell it that we don’t want to see the sparklines, just the big number.
Provide some customizations around how to treat the data.
In order to display a single numerical value on the stat panel, we need to customize it to calculate the mean of the provided values. As metric queries return time series, we can use this customization to see the average of all values in this particular example.
2. Time series
The second visualization we’re going to use is a TimeSeries panel, because we want to see how data changes over a period of time.
import { SceneQueryRunner, PanelBuilders } from '@grafana/scenes';

const timeSeriesQueryRunner = new SceneQueryRunner({
    datasource: {
        type: 'loki',
        uid: '$ds',
    },
    queries: [
        {
            refId: 'B',
            expr: 'count_over_time({$stream_name="$stream_value"} [$__auto])',
        },
    ],
});

  const timeSeriesPanel = PanelBuilders
    .timeseries()
    .setTitle('Logs over time')
    .setData(timeSeriesQueryRunner);
This one is simpler, and works out of the box without customizations.
3. Logs panel
For our logs panel we will use a qryn log query + a log visualization widget.
import { SceneQueryRunner, PanelBuilders } from '@grafana/scenes';

const logsQueryRunner = new SceneQueryRunner({
    datasource: {
        type: 'loki',
        uid: '$ds',
    },
    queries: [
        {
            refId: 'A',
            expr: '{$stream_name="$stream_value"}',
            maxLines: 20, // Use up to 5000
        },
    ],
});

  const logsPanel = PanelBuilders.logs()
    .setTitle('Logs')
    .setData(logsQueryRunner);
Arrange the scenes
To organize the scenes, we will follow these steps:
First, we have gathered all the necessary building blocks for our application. Now, in the final stage, we need to pass these objects to the Scenes library and determine how they should be organized in the UI. To achieve this, we will utilize a grid layout.
This layout is the default behavior of dashboards in Grafana, and it provides a similar experience for our scenes. Within the grid layout, we will incorporate three SceneGridItem components. In order to pass the variables to our scene, we will encapsulate them within a SceneVariableSet.
Lastly, we will arrange the scene in a way that grants the user access to certain controls. These controls include:
VariableValueSelectorsto modify the variable controls.SceneControlsSpacerto add a little bit of air between objects.SceneTimePickerto customize the time selection.
export function getBasicScene() {
    // Everything before goes over here
    return new EmbeddedScene({
        $timeRange: timeRange,
        $variables: new SceneVariableSet({
            variables: [dsHandler, streamHandler, streamValueHandler],
        }),
        body: new SceneGridLayout({
            children: [
                new SceneGridItem({
                    height: 8,
                    width: 8,
                    x: 0,
                    y: 0,
                    body: statPanel.build(),
                }),
                new SceneGridItem({
                    height: 8,
                    width: 16,
                    x: 8,
                    y: 0,
                    body: timeSeriesPanel.build(),
                }),
                new SceneGridItem({
                    height: 8,
                    width: 24,
                    x: 0,
                    y: 4,
                    body: logsPanel.build(),
                })
            ],
        }),
        controls: [
            new VariableValueSelectors({}),
            new SceneControlsSpacer(),
            new SceneTimePicker({ isOnCanvas: true }),
        ],
    });
}
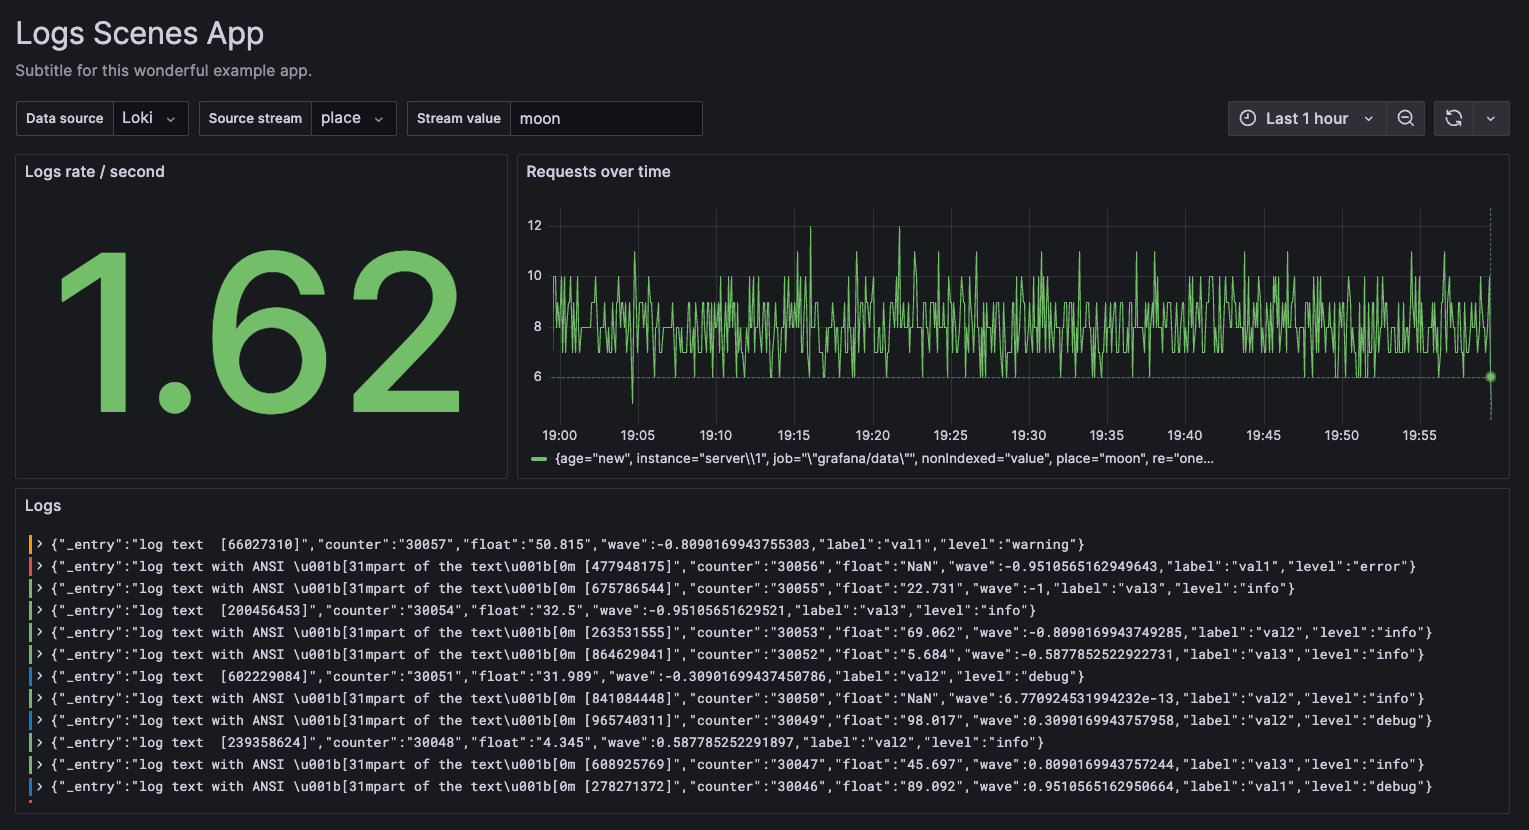
If you followed our tutorial, the results should look similar to the following example:
Conclusion
Now we know how to develop a Grafana plugin and how to use the Scenes library to constructing interactive interfaces with visualizations using qryn's Loki and LogQL compatible APIs. This experiment further confirms our vision: being polyglot rocks!
That's right! Since qryn is a drop-in compatible LGTM alternative, any guide or tutorial designed and created for Grafana Loki, Mimir or Tempo will work out of the box when used with qryn and qryn.cloud using our custom made APIs built on top of fast and scalable OLAP databases such as ClickHouse, DuckDB and InfluxDB.
Ready to try? Deploy qryn OSS locally or try our qryn.cloud managed service 👇
