


Fly is a platform for running full stack apps and databases close to your users. We’ve been hammering on this thing since 2017, and we think it’s pretty great.
Lots of smart people love Fly.io and run their apps on this great platform!
Each Fly Apps will produce logs, helpful if not essential for a variety of use cases - debugging, tracking, collating, correlating, coalescing, and condensing the happenings of your running code into useful bits of human-parsable information.
But since Fly.io doesn’t keep your logs around forever to make the best of them we can store and explore data using services such as qryn and qryn.cloud, without loosing any of the Grafana compatibility and Dashboards Fly.io offers by default.
How can we do that? Luckily for us fly.io is always super elegant and very generously routes all Firecracker VM logs through NATS, ready to be picked up and processed.
🎈 Fly higher with qryn
To get logs all you need is an app that acts as a NATS client, reads the logs, and ships them somewhere. Vector can do just that and since it supports qryn natively through the Loki and Prometheus sinks, it works out of the box with our example.
Using the Log Shipper
For our example we'll use use the fly-log-shipper example, extended for qryn.
The fly NATS log stream is scoped to your user organization, which means the Fly Log Shipper collects logs from all your applications at once. Very practical.
Here's a quick example using a custom qryn sink for shipping logs and metrics:
# Make a directory for qryn log shipper
mkdir logshippper
cd logshippper

# I chose not to deploy yet
fly launch --image qxip/fly-log-shipper:latest

# Set secrets to enable qryn integration
fly secrets set ORG=personal
fly secrets set ACCESS_TOKEN=$(fly auth token)
fly secrets set QRYN_URL=<qryn API URL>
fly secrets set QRYN_USERNAME=<qryn API user>
fly secrets set QRYN_PASSWORD=<qryn API token>
Before launching your application, you should edit the generated fly.toml file and delete the entire [[services]] section. Replace it with this:
[[services]]
  http_checks = []
  internal_port = 8686
Once ready deploy the qryn log shipper application to your stack:
fly deploy
You’ll soon start to see logs appear from all of your apps:

NOTE: shipping logs to qryn does not interrupt the native logging feature!
What's happening under the hood?
Vector receives all the organization logs through NATS
NATS sourced logs are parsed and labeled for the Loki sink
Vector ships parsed logs to a Loki sink pointed at qryn or qryn.cloud
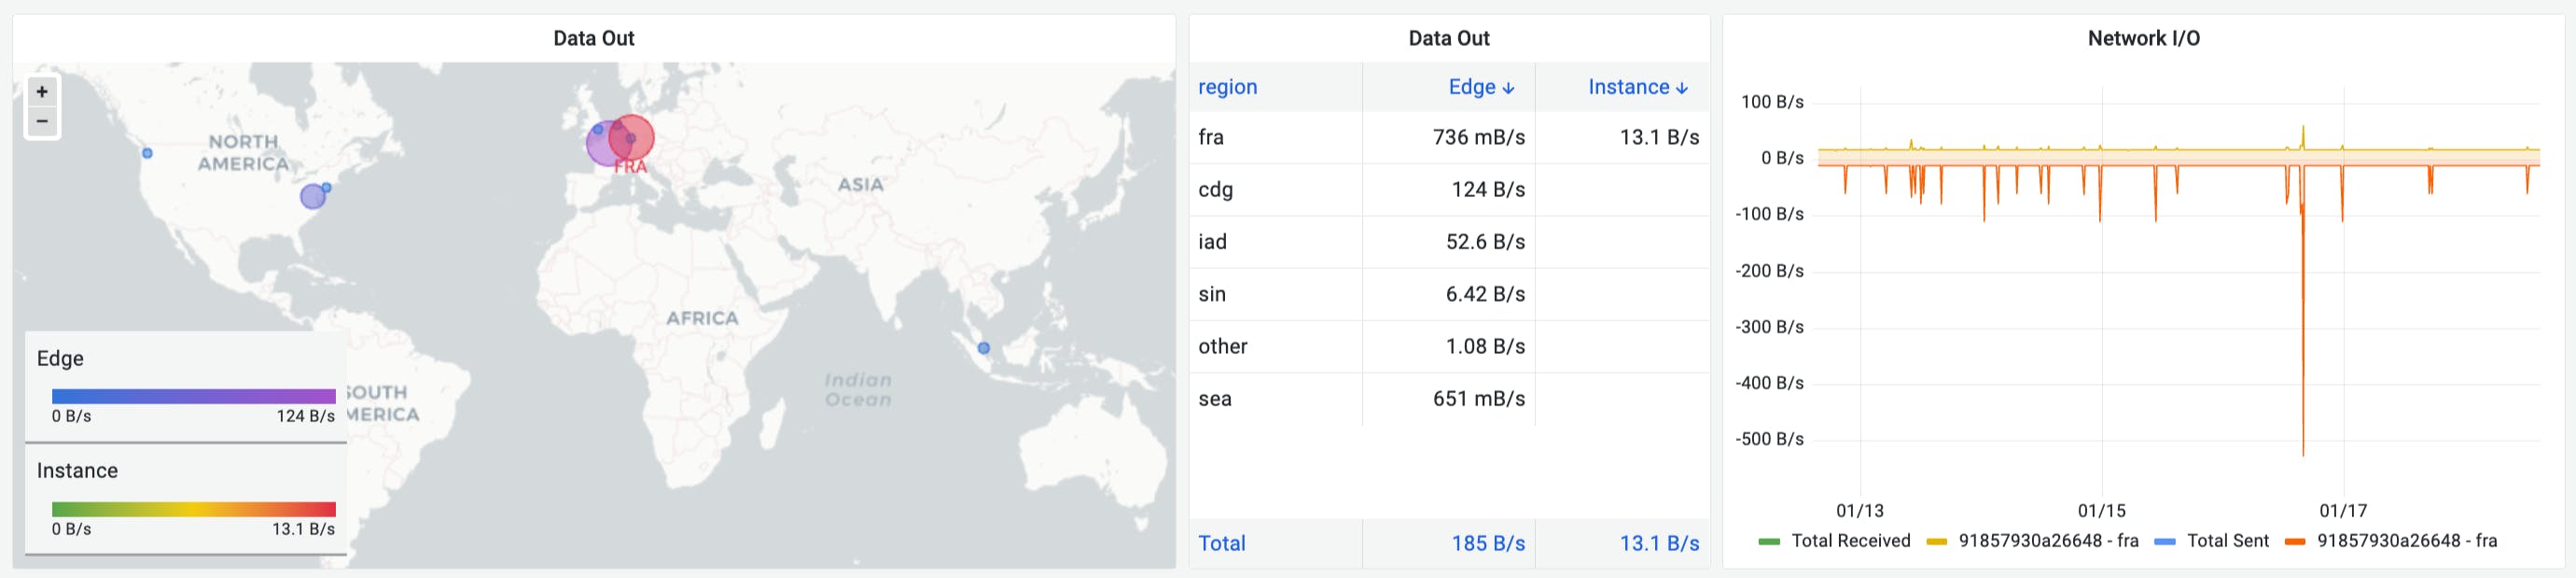
Fly Metrics
Fly.io produces granular metrics for all running applications using an internal shared Prometheus and Grafana service. Those seems to be long-retention but you might still want to pull them into your own stack for further processing and analysis.
To scrape those metrics into our custom solution we can use an extension to the existing Vector configuration to scrape all our organization timeseries using the same Fly.io access token used for our NATS connections, query matching all apps.
[sources.flyio_metrics]
  type = "prometheus_scrape"
  endpoints = [ "https://api.fly.io/prometheus/personal/federate" ]
  auth.strategy = 'bearer'
  auth.token = "${ACCESS_TOKEN?}"
  query.match = ['{app=~".+"}']
The resulting metrics are shipped to qryn using a standard remote_write API. Easy!
To reproduce the full experience, export & recycle Fly's Grafana dashboards.
OLAP-in-One
That's it! You're now ready to query your logs using Loki/LogQL and your metrics using Prometheus/PromQL and ready to receive Traces and Continuous Profiling events from within your App code using Tempo and Pyroscope compatibility.
Using the same process you can ship logs, metrics or traces from any stack.
Get Polyglot
Tired of unnecessary complexity? Join our polyglot observability journey today and regain control of your data with qryn oss or qryn.cloud for all of your Logs, Metrics, Traces and Profiling while saving a ton in cost and resources and without forcing your teams to learn new query languages and without having to change your tools.
Which stack would you like to see next? Let us know in the comments.