


Benchmarks for embedded SQL databases are rarely impartial and they tend to use larger-than-life configurations by each vendor in their race for the market peak. The typical megalomaniac benches ($$$) are usually both scientifically and technically accurate but they rarely translate into anything useful for us regular end-users deploying their databases on the lowest tier options and using cheap resources.
With this in mind, we decided to assemble a simple and "fair" benchmarking tool
The rules for our little game are simple:
No reliance on dedicated CPUs and fast RAM. Cheap stuff only.
Focus on real network operations with remote parquet files.
Mimicking real-life scenarios and queries (as a query collection)
GitHub Actions
GitHub Actions runners are a great example of "cheap resources" (as in free) offering us 2vCPUs and 7GBs of RAM for each execution. We decided to use actions to benchmark our target databases equally sharing the pros and cons uniformly.
Python
Python will be our playground since most embedded OLAP databases support it.
Our runner will orderly spawn the same SQL tests against each of the contending databases in separate parallel sessions operating with equal CPU/RAM/Network resources and remote parquet files with local tests for balance. No caching allowed.

A few hours later our first action-based benchmark playground was ready to run with tests covering our first group of embedded SQL OLAP engines:
⏩ If you want to fast-forward to the code and real action reports:
GitHub Repo: https://github.com/lmangani/embedded-db-benchmarks
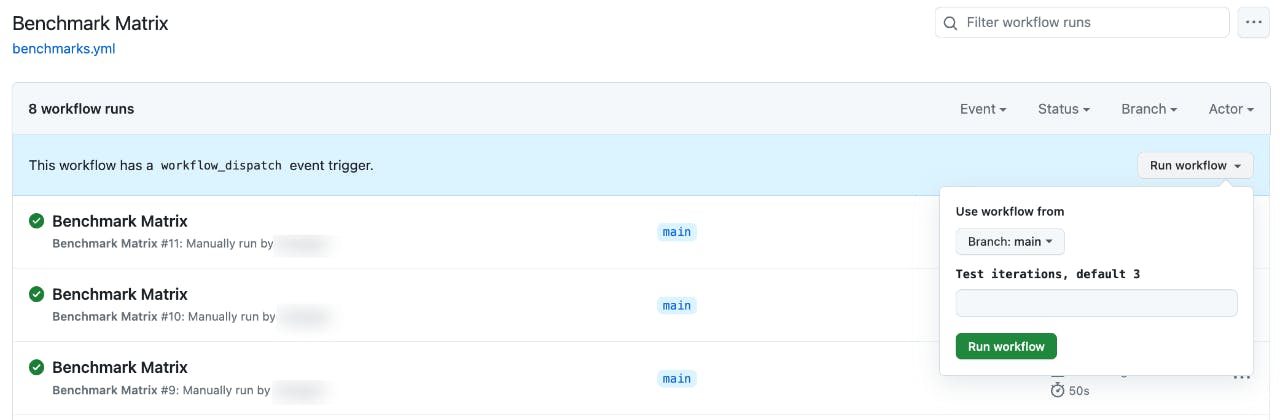
Test groups are executed on demand with a customizable number of iterations:
Query Results
For each run and each database runner, separate query statistics are collected.
Here are some sample speed results for chdb (0.15.0) and duckdb (0.9.1):
Testing chdb (0.15.0)
chdb:version: avg=0.018s min=0.017s max=0.020s (3 runs)
chdb:count: avg=0.312s min=0.210s max=0.502s (3 runs)
chdb:groupby: avg=0.772s min=0.742s max=0.824s (3 runs)
chdb:groupby-local: avg=0.436s min=0.432s max=0.441s (3 runs)

Testing duckdb (0.9.1)
duckdb:version: avg=0.000s min=0.000s max=0.001s (3 runs)
duckdb:count: avg=0.358s min=0.120s max=0.823s (3 runs)
duckdb:groupby: avg=0.778s min=0.769s max=0.793s (3 runs)
duckdb:groupby-local: avg=0.498s min=0.494s max=0.505s (3 runs)
Each group runs all tests in parallel, making it easy to compare changes over time.
For instance, here's the latest chdb (0.16.0rc2) gaining speed on parquet counts 🔥
Testing chdb (0.16.0rc2)
chdb:version: avg=0.011s min=0.011s max=0.012s (5 runs)
chdb:count: avg=0.160s min=0.082s max=0.386s (5 runs) 🔥
chdb:groupby: avg=0.445s min=0.407s max=0.496s (5 runs) 🔥
chdb:groupby-local: avg=0.338s min=0.325s max=0.344s (5 runs) 🔥

Testing duckdb (0.9.1)
duckdb:version: avg=0.000s min=0.000s max=0.000s (5 runs) 🔥
duckdb:count: avg=0.259s min=0.098s max=0.894s (5 runs)
duckdb:groupby: avg=0.571s min=0.566s max=0.576s (5 runs)
duckdb:groupby-local: avg=0.341s min=0.334s max=0.351s (5 runs)
With each test, there's a pinch of luck involved. This is why multiple run are needed.
⚠️ Remember our bench does not want to be authoritative - it wants to be realistic!
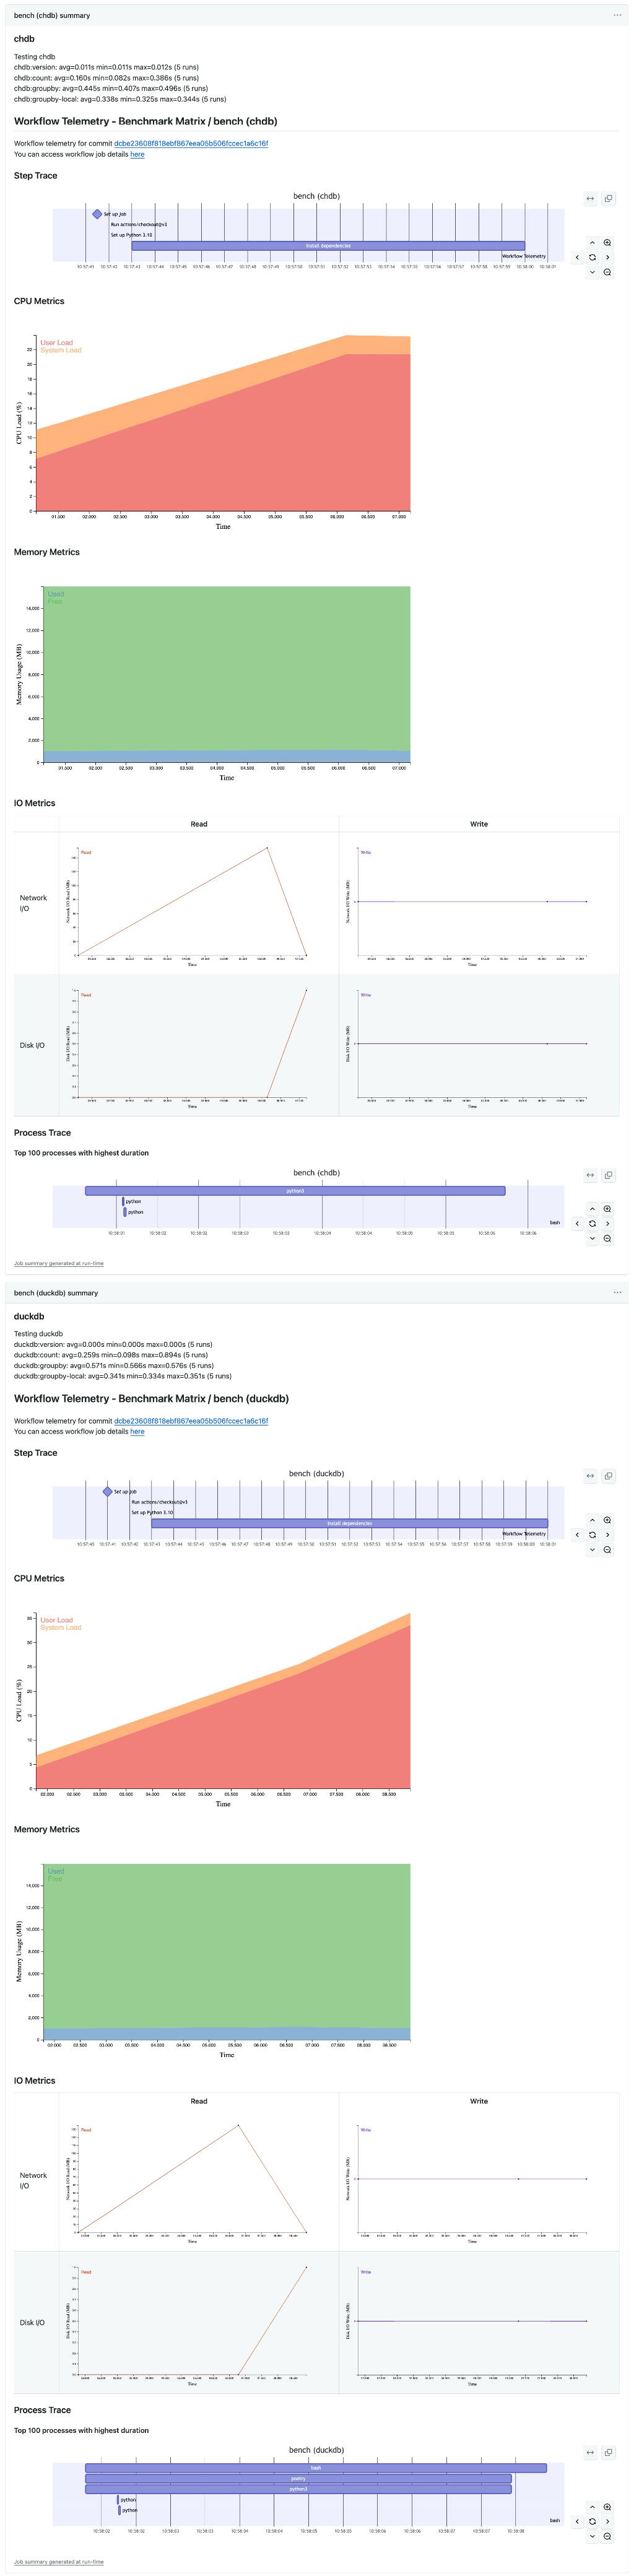
Full Reports
The benchmarking actions tracks the system resource utilization during tests.
For instance, we can see how chdb peaks its CPU utilization at 23% while duckdb reaches 36% within the same timeframe of execution. Pretty interesting 🔥
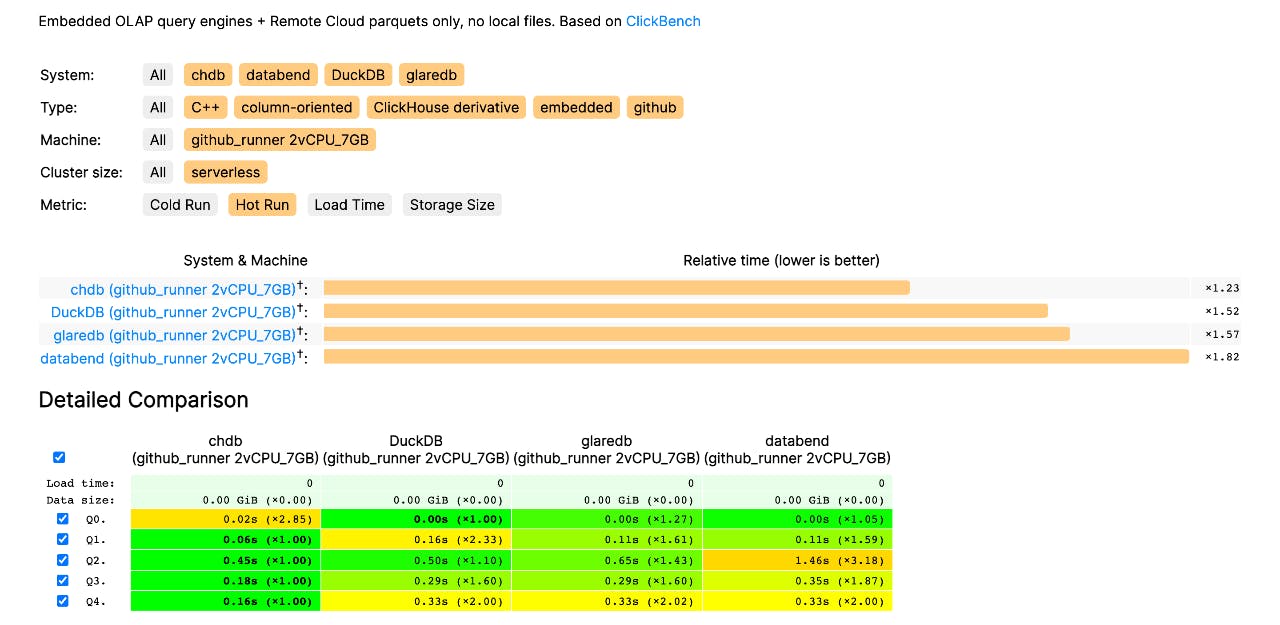
First Conclusions
Here's one of the latest runs: chdb, duckdb followed by glaredb compete for the top positions while databend and datafusion results in the slowest and more memory hungry. Network fluctuations and latency issues play a role - just like in real life!
Do you think our tests are penalizing any engine? Shall we run multiple rounds and aggregate results? Please submit a PR or open an issue and we'll try anything!
Testing chdb 0.16.0rc2 (23.10.1.1)
chdb:version: avg=0.012s min=0.011s max=0.014s (3 runs) | Memory used: 2.47 MB
chdb:count: avg=0.135s min=0.064s max=0.264s (3 runs) | Memory used: 3.91 MB
chdb:groupby: avg=0.435s min=0.407s max=0.478s (3 runs) | Memory used: 25.98 MB

Testing duckdb 0.9.1
duckdb:version: avg=0.001s min=0.000s max=0.001s (3 runs) | Memory used: 2.96 MB
duckdb:count: avg=0.360s min=0.083s max=0.900s (3 runs) | Memory used: 26.02 MB
duckdb:groupby: avg=0.697s min=0.685s max=0.715s (3 runs) | Memory used: 25.86 MB

Testing glaredb 0.5.1
glaredb:version: avg=0.001s min=0.000s max=0.001s (3 runs) | Memory used: 11.38 MB
glaredb:count: avg=0.157s min=0.071s max=0.307s (3 runs) | Memory used: 9.00 MB
glaredb:groupby: avg=0.489s min=0.482s max=0.496s (3 runs) | Memory used: 200.90 MB

Testing databend 1.2.207
databend:version: avg=0.013s min=0.001s max=0.038s (3 runs) | Memory used: 3.50 MB
databend:count: avg=0.237s min=0.216s max=0.277s (3 runs) | Memory used: 7.50 MB
databend:groupby: avg=1.629s min=1.580s max=1.674s (3 runs) | Memory used: 462.03 MB

Testing datafusion 32.0.0
datafusion:version: avg=0.016s min=0.001s max=0.045s (3 runs) | Memory used: 3.62 MB
datafusion:count: avg=0.243s min=0.179s max=0.338s (3 runs) | Memory used: 7.12 MB
datafusion:groupby: avg=1.860s min=1.820s max=1.920s (3 runs) | Memory used: 474.79 MB
CloudBench
This way of testing is showing potential, but why should we reinvent the wheel? Due to popular demand, we're porting our action-based benchmarks to ClickBench
Observability
The reports are still quite generic and provide useful insight into test execution directly from our actions, without any cost or any external service required. But to determine anything scientific we need to collect thousands of executions over time.
To track and analyze the performance of each test over time we can configure our Reports to be shipped as complete logs, metrics and traces directly into qryn 👇👇