


TLDR
Monitor your web applications with qryn in < 60 lines of code.
The Context
Monitoring is often done on the server side. It's simpler, it's what we control and they are within our network, so it's easy to send logs, metrics and traces around.
But that only captures one side of the equation. Although we write and distribute the client code, there is much we do not control about it, but we would still be interested in knowing how our clients perform and if there is any errors.
QRYN makes it easy to monitor on the server side, but using it in a more advanced way, even client side logging becomes super simple.
Last week Grafana announced their client side Monitoring Tool Faro. I was excited, because as usual QRYN is compatible to receive the output of Grafana's new monitoring layer. I immediately wanted to try it out.
Understandably, Grafana caters to REACT and Angular and the current typescript to JavaScript transpile community. This is great when you are trying to use their product in your already compiled code base and want reliable code that works everywhere where a builder can go.
It's not so great when you are trying to put together a small, simple test to check the functionality and use case for your existing front-end application. In fact it's quite frustrating when you need to first build, then copy about 20 files from one directory and another 20 files from another (Core vs Web SDK code) into your already existing development project just to see what it does. I recommend minified pre-compiled files that can be used by just adding a script tag to the HTML file.
Instead of being frustrated however, I turned it into motivation to show that simplicity is all one needs to get started as a developer wanting to add monitoring to their front end quickly, simply and in less than 60 Lines of Code.
At first I will introduce the method and a few variations of it. Then I will illustrate a slightly deeper (but not more complex) method to add this method into a practical example to monitor deeper statistics from the client-side.
The Method
What is great about this method is that it works straight out of the box by simply copying the below code into your distributed index.html page. We make it even easier by providing it as a small library: boscaiolog
const logger = console

console.log = async function (log_content) {
  logger.info(log_content) // don't do logger.log or you'll create an infinite recursion

  var res = await fetch('https://qryn.yourdomain.com/weblogs/_doc/', {
    method: "POST",
    body: JSON.stringify(log_content)
  }).catch((err)=>{
    console.error(err)
  })
}
So what are we doing?
For one, we are splitting any existing console.log statement and we are sending it to console.info instead. (To avoid an infinite loop of logs) And then we send the logs to QRYN's elastic endpoint.
The content can be wrapped and perhaps you have a 'visitorIdentifier' or some other information you'd like to add and wrap into the object before it gets sent. Here I have added an UUID that is generated on each reload of the page:
const logger = console
const identifier = 'xxxxxxxx-xxxx-4xxx-yxxx-xxxxxxxxxx'.replace(/[xy]/g, function(c) {
     let r = Math.random() * 16 | 0, v = c == 'x' ? r : (r & 0x3 | 0x8);
     return v.toString(16);
   })

console.log = async function (log_content) {
  logger.info(log_content) // don't do logger.log or you'll create an infinite recursion
  let object = {
    id: identifier,
    log: log_content
  }
  var res = await fetch('https://qryn.yourdomain.com/weblogs/_doc/', {
    method: "POST",
    body: JSON.stringify(log_content)
  }).catch((err)=>{
    console.error(err)
  })
}
Now each visit to your app gets a unique identifier and will log it's logs directly into QRYN. (BTW, this may be a cloud hosted QRYN or it could be an on-the-edge receiver that runs as a worker inside Cloudflare, or as a raspberry pi deployment, e.g. here)
All without having to add another API route on your server to receive logs and do something with them. Just add the code or file and done.
The Example
One of my first adventures in web technologies was Meething our answer to the need for a No-Install Conference Service in the web. Discovering WebRTC was an eye opener and it spurred a few ideas, that led to my first npm package.
But WebRTC can also be hard and complex. Hence there is many solutions to make using it a lot easier. One of them is Janus a General WebRTC Server that implements multiple ways of transports and setups, plus client application code.
Skip this section if you aren't interested in logging RTC details to QRYN.
Janus
Janus provides Media Reports from it's server directly, as accurate as this may be, we want to see more. And what better than the Statistics directly provided by the Browser.
For this to work, we need a reference to the Peer Connection Object we create when we start our connection.
Janus exposes the Peer Connection Object in it's demo code and so by simply adding the following modified version of our previous code:
async function main () {
  if (window.mixertest) {
    try {
      var stats = await window.mixertest.webrtcStuff?.pc?.getStats()
      stats.forEach((stats)=>{sendStats(stats)})
    } catch (err) {
      // swallow
    }
  }
}

async function sendStats (object) {
  let obj = object
  const handler_id = window.mixertest?.getId()
  obj.__handle_id = handler_id
  const session_id = window.mixertest?.session?.getSessionId()
  obj.__session_id = session_id

  var res = await fetch('https://qryn.yourdomain.com/janus/_doc/' + session_id, {
    method: "PUT",
    body: JSON.stringify(obj)
  }).catch((err)=>{console.error(err)})
}

setInterval(main, 10000)
This will send the Statistics every 10 seconds and send it our QRYN end point, where we can turn it into Metrics to inspect details of our session.
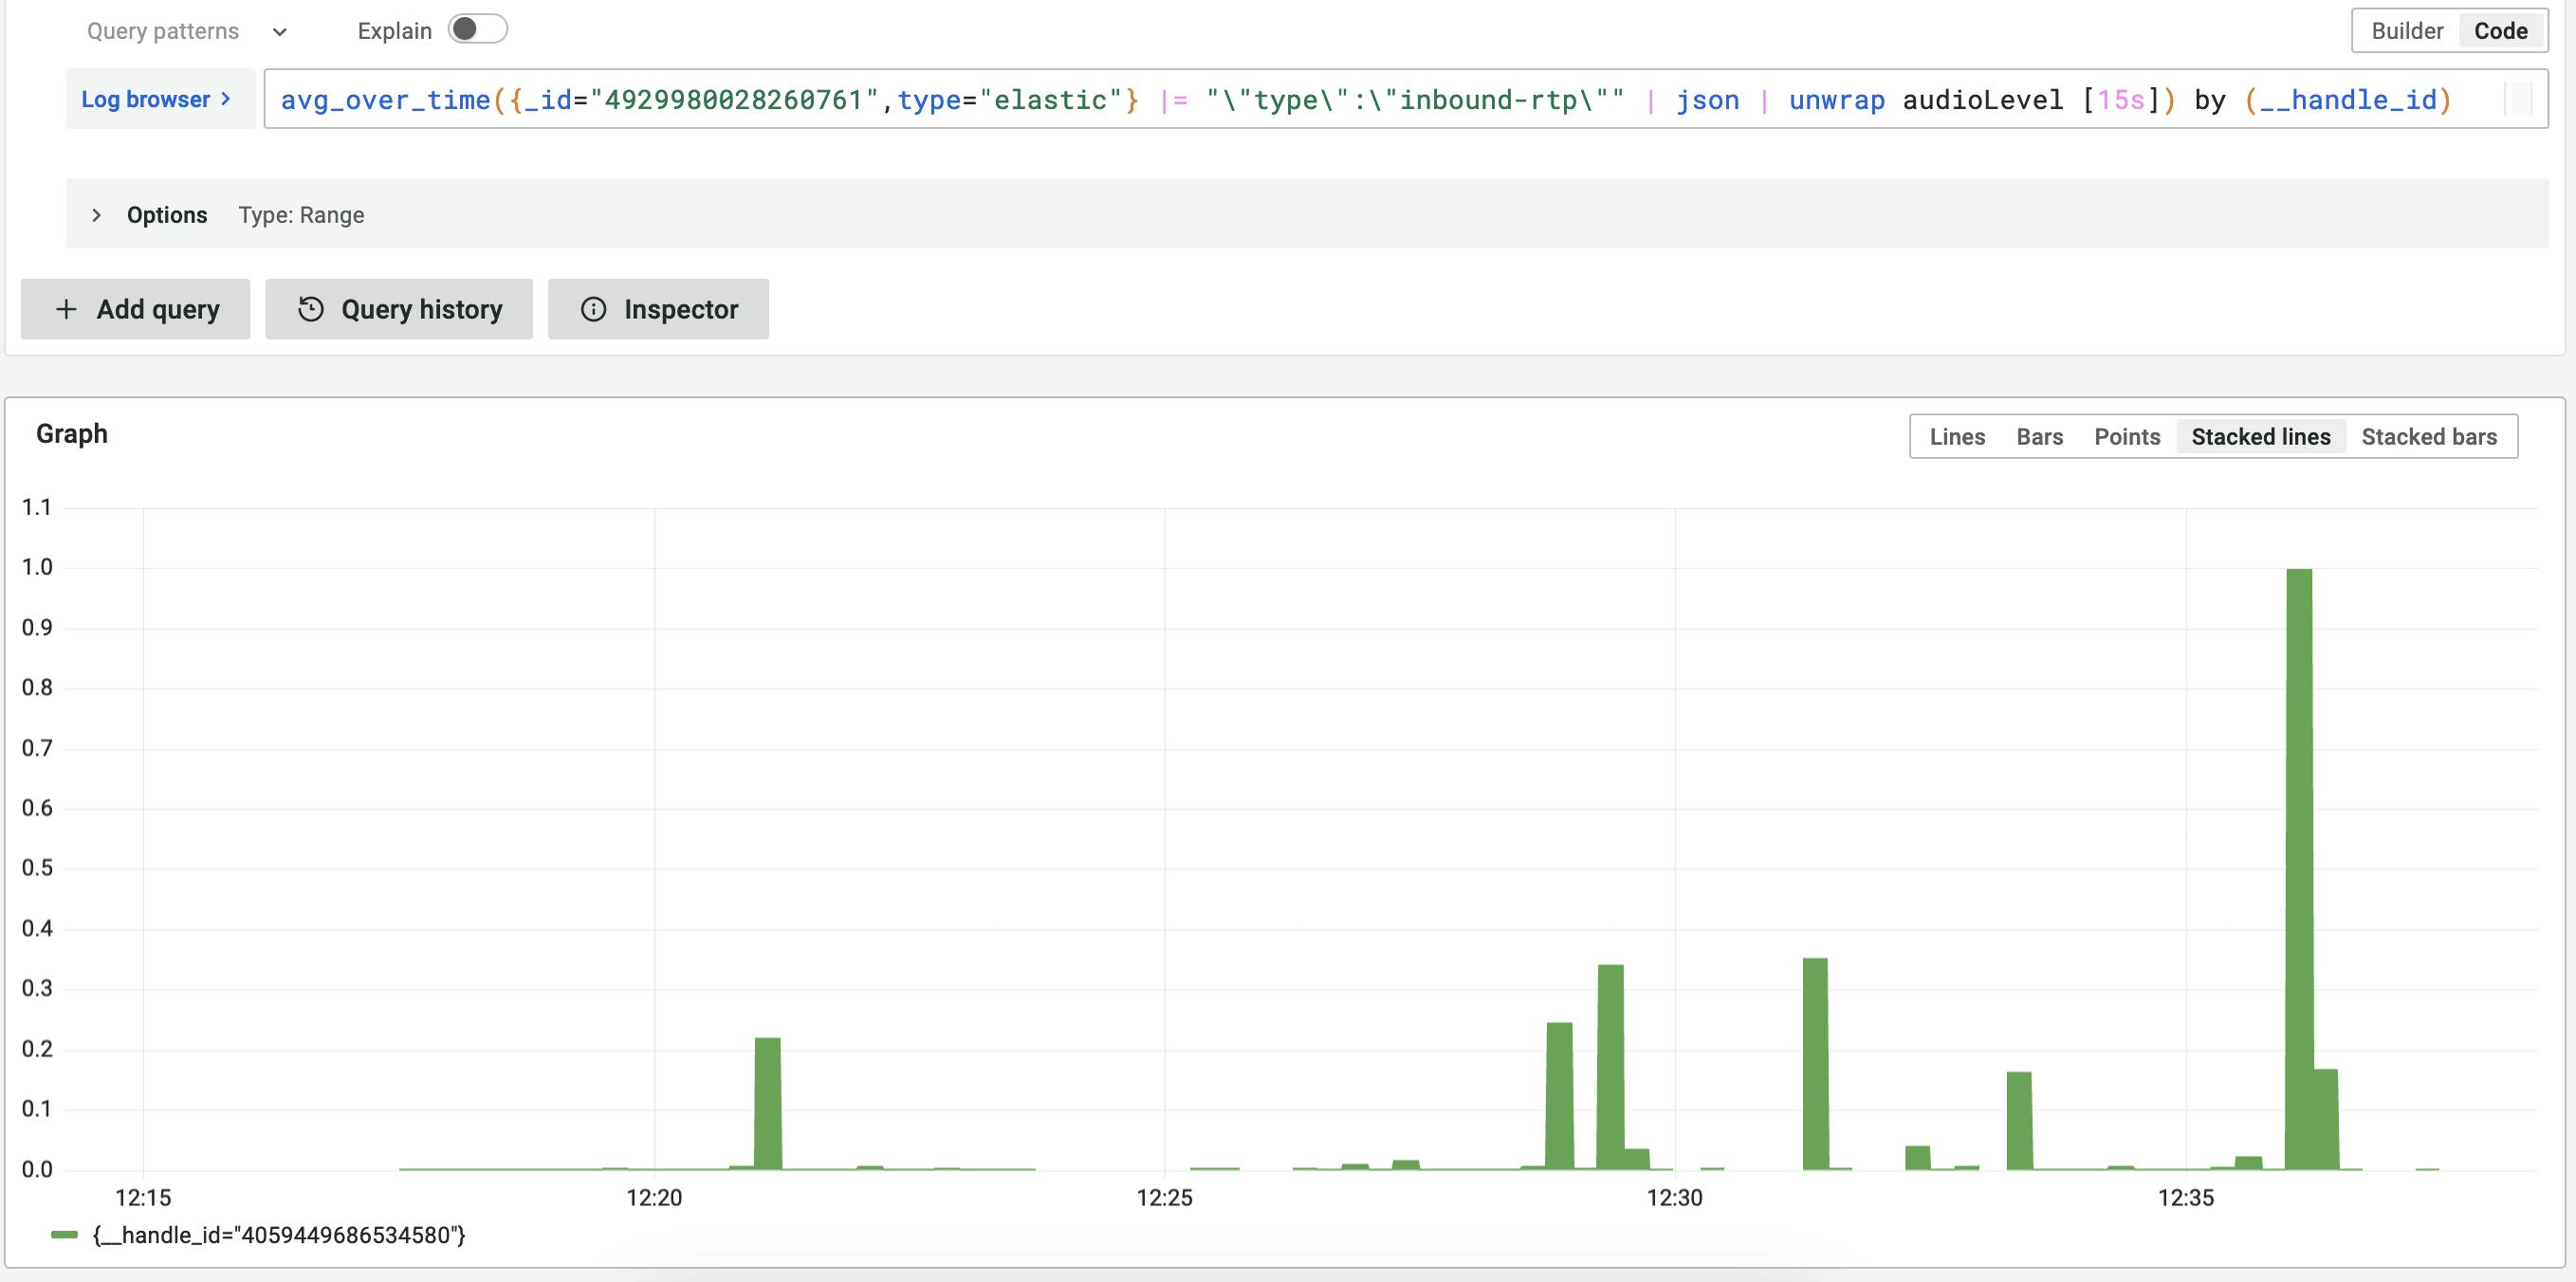
Audio Levels over this User (Silence of the Lambs)
The Conclusion
In less than 60 lines of code we add Monitoring to our client-side application. Either as a console.log overwrite or integrated with the application to give us direct insight into the specific logs, metrics (and soon traces as well, although they require more than 60 lines of code and a bit more work to integrate in your business logic).
Try it out on your system or deploy on our cloud service to get an endpoint.