
OpenTelemetry collector + qryn
Native OpenTelemetry Support and more protocols!


You asked, we listened. Say hello to the qryn opentelemetry collector 🎉
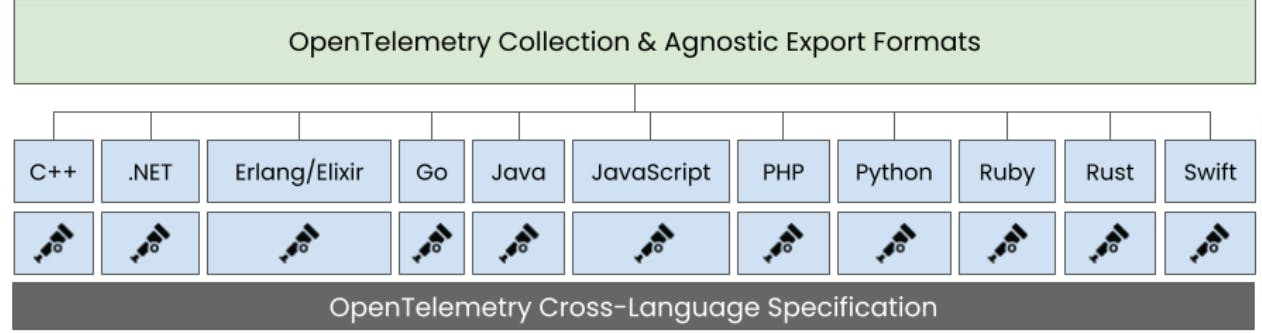
The OpenTelemetry Collector offers a vendor-agnostic implementation on how to receive, process and export telemetry data. In addition, it removes the need to run, operate and maintain multiple agents/collectors in order to support open-source telemetry data formats (e.g. Jaeger, Prometheus, etc.) sending to multiple open-source or commercial back-ends.
This fits like a glove around qryn, which replaces multiple open-source or commercial observability back-ends at once - we could paraphrase this for our project:
qryn offers a polyglot, vendor-agnostic implementation of ingestion, storage and query backend APIs to manage logs, metrics and telemetry data (LogQL, PromQL, Tempo, Zipkin, etc.) removing the need to run, operate and maintain multiple observability backends (Loki, Tempo, Mimir, Prometheus, etc.)
Use Case
The qryn-otel-collector is designed to store OpenTelemetry data (Traces, Logs, Metrics) directly into ClickHouse using qryn fingerprinting and table formats.
Effectively, a bypass for ingesting data without passing through qryn APIs transforming Clickhouse into a massive OpenTelemetry ingestion backend.

The resulting data tables can be transparently accessed and queried through all of the qryn API integrations such as LogQL, PromQL and Tempo using Grafana.

Insert Performance
This setup is ideal for high-pressure setups where a scalable set of Open Telemetry collectors can be deployed to replace qryn for the writing role into a ClickHouse running either on a local instance or cloud powered cluster.
Format Reliability
The qryn otel collector maximizes reliability, compatibility and efficiency when using native Open Telemetry compatible instrumentation libraries in your code:
Configuration Example
If you've worked with the otel collector before, you can jump straight into action using our public docker container image: ghcr.io/metrico/qryn-otel-collector
otel-collector:
    container_name: otel-collector
    image: ghcr.io/metrico/qryn-otel-collector:latest
    volumes:
      - ./otel-collector-config.yaml:/etc/otel/config.yaml
    ports:
      - "4317:4317"     # OTLP gRPC receiver
      - "4318:4318"     # OTLP HTTP receiver
      - "14250:14250"   # Jaeger gRPC
      - "14268:14268"   # Jaeger thrift HTTP
      - "9411:9411"     # Zipkin port
      - "24224:24224".  # Fluent Forward
    restart: on-failure
Here's a full example leveraging a combination of Trace, Logs and Metric collectors:
| Receiver | Type | Emitter |
| OTEL | Traces | qryn-traces |
| Jaeger | Traces | qryn-traces |
| Zipkin | Traces | qryn-traces |
| Fluentd | Logs | qryn-logs |
| Prometheus | Metrics | qryn-metrics |
| Trace Graph | Metrics | qryn-metrics |
receivers:
  otlp:
    protocols:
      grpc:
        endpoint: 0.0.0.0:4317
      http:
        endpoint: 0.0.0.0:4318
  jaeger:
    protocols:
      grpc:
        endpoint: 0.0.0.0:14250
      thrift_http:
        endpoint: 0.0.0.0:14268
  zipkin:
    endpoint: 0.0.0.0:9411
  fluentforward:
    endpoint: 0.0.0.0:24224
  prometheus:
    config:
      scrape_configs:
        - job_name: 'otel-collector'
          scrape_interval: 5s
          static_configs:
            - targets: ['exporter:8080']
processors:
  batch:
    send_batch_size: 10000
    timeout: 5s
  memory_limiter:
    check_interval: 2s
    limit_mib: 1800
    spike_limit_mib: 500
  resourcedetection/system:
    detectors: ['system']
    system:
      hostname_sources: ['os']
  resource:
    attributes:
      - key: service.name
        value: "serviceName"
        action: upsert
  spanmetrics:
    metrics_exporter: otlp/spanmetrics
    latency_histogram_buckets: [100us, 1ms, 2ms, 6ms, 10ms, 100ms, 250ms]
    dimensions_cache_size: 1500
  servicegraph:
    metrics_exporter: otlp/spanmetrics
    latency_histogram_buckets: [100us, 1ms, 2ms, 6ms, 10ms, 100ms, 250ms]
    dimensions: [cluster, namespace]
    store:
      ttl: 2s
      max_items: 200
  metricstransform:
    transforms:
      - include: calls_total
        action: update
        new_name: traces_spanmetrics_calls_total
      - include: latency
        action: update
        new_name: traces_spanmetrics_latency
exporters:
  qryn:
    dsn: tcp://clickhouse-server:9000/cloki?username=default&password=*************
    timeout: 10s
    sending_queue:
      queue_size: 100
    retry_on_failure:
      enabled: true
      initial_interval: 5s
      max_interval: 30s
      max_elapsed_time: 300s
    logs:
       format: json
  otlp/spanmetrics:
    endpoint: localhost:4317
    tls:
      insecure: true
extensions:
  health_check:
  pprof:
  zpages:
  memory_ballast:
    size_mib: 1000

service:
  extensions: [pprof, zpages, health_check]
  pipelines:
    logs:
      receivers: [fluentforward, otlp]
      processors: [memory_limiter, resourcedetection/system, resource, batch]
      exporters: [qryn]
    traces:
      receivers: [otlp, jaeger, zipkin]
      processors: [memory_limiter, resourcedetection/system, resource, spanmetrics, servicegraph, batch]
      exporters: [qryn]
    metrics/spanmetrics:
      receivers: [otlp]
      processors: [metricstransform]
      exporters: [qryn]
    metrics:
      receivers: [prometheus]
      processors: [memory_limiter, resourcedetection/system, resource, batch]
      exporters: [qryn]
More Ingestion Formats
There's more Good News! All of the open telemetry collector ingestion formats for traces, logs and metrics can now be used with qryn using the new otel collector.
This includes standard and contributed modules expanding qryn's polyglot scope even further with additional ingestors compatible with Datadog, AWS XRay, Elasticsearch, InfluxDB, Splunk, Riak, MongoDB and so many more.
Help yourself to more Observabiity! 🚀
Credits
Special credits to our resident contributor Cluas for this great achievement!

Cloud Up
Experimenting with qryn at large? Check our service at qryn.cloud including a dedicated cloud collector with support for partitioning, clustering and much more!