🦗 Odigos + qryn = zero instrumentation
Effortless K8s Observability with Odigos and qryn

Detect and Fix Production Issues Faster with Odigos & qryn
Odigos is designed to automatically instruments get distributed traces, metrics and logs for any Kubernetes application in minutes, without any code changes.
Odigos detects the programming language of your applications and applies automatic instrumentation using well-known, battle-tested open source observability technologies such as OpenTelemetry and eBPF.
Tutorial
In this tutorial we are going to use Odigos for getting automatic observability of a microservices application written in Go, Java, Python, .NET and Node.
Odigos v0.1.36+ natively supports qryn as destination for traces, logs and metrics.
📚 This guide is adapted from the odigos documentation examples
Prerequisites
To follow the guide, you need the following:
A Kubernetes cluster.
Helm CLI for installing helm charts.
A qryn or qryn.cloud deployment.
Creating the Kubernetes cluster
Create a new local Kubernetes cluster, by running the following command:
kind create cluster
Deploying the target application
For this tutorial, we are going to install a fork of microservices-demo. We use a modified version without any instrumentation code to demonstrate how Odigos automatically collects observability data from the application.
Deploy the demo application using the following command:
kubectl apply -f https://raw.githubusercontent.com/keyval-dev/microservices-demo/master/release/kubernetes-manifests.yaml
Before proceeding, make sure that all the application pods are running.
Installing Odigos
The easiest way to install Odigos is to use the official helm chart:
helm repo add odigos https://keyval-dev.github.io/odigos-charts/
helm install my-odigos odigos/odigos --namespace odigos-system --create-namespace
After all the pods in the odigos-system namespace are running, open the Odigos UI by running the following command and navigate to [localhost:3000]
kubectl port-forward svc/odigos-ui 3000:3000 -n odigos-system
Choosing where to send the data
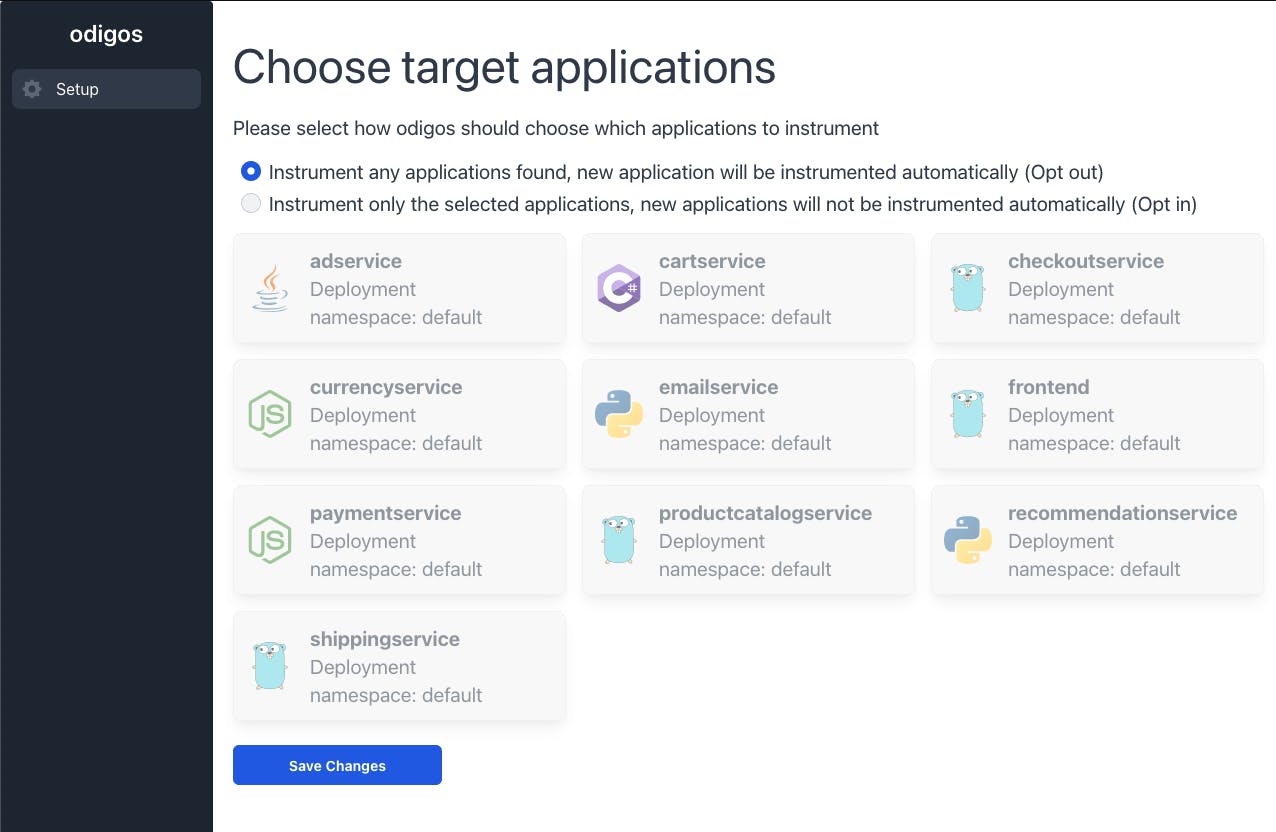
You should now see the following page:

After Odigos detected all the applications in the cluster, choose the opt out option for application instrumentation. opt in mode is recommended when you want to have greater control over which applications are instrumented.
On the next page, select qryn as the destination for the data:

Fill in the following information using your relevant qryn details:
Tempo URL:
https://qryn.host/tempo/api/pushPrometheus URL:
https://qryn.host/api/prom/remote/writeLoki URL:
https://qryn.host/loki/api/v1/push
Generating data
That’s it! Odigos will automatically do the following:
Instrument all the applications in the cluster:
Runtime languages will be instrumented using OpenTelemetry.
Compiled languages will be instrumented using eBPF.
Deploy and configure a collector to send the data to qryn.
Now all that is left is to generate some traffic in the application.
Execute the following command to port forward into the application UI:
kubectl port-forward svc/frontend 1234:80 -n default
Navigate to [localhost:1234] and perform fake some purchases.
Exploring the collected data
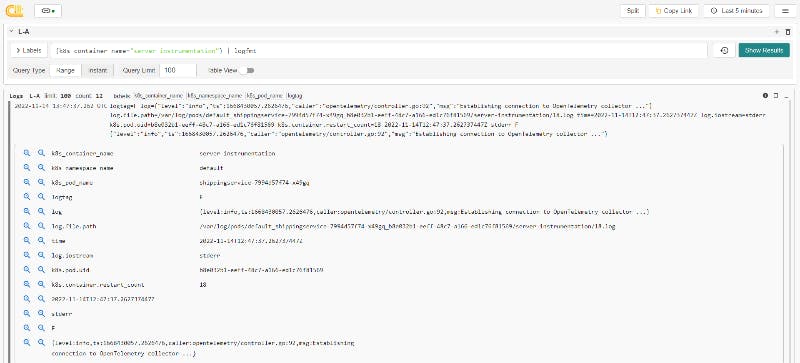
Within minutes, you should see distributed traces appear in qryn. You now have all the data needed to understand how your application is behaving, without having to do any additional work. Using this configuration any new application deployed to this Kubernetes cluster will automatically be instrumented and sent to qryn.

Cleanup
Delete the Kubernetes cluster by running the following command:
kind delete cluster
Conclusion
Odigos is pretty amazing at generating distributed traces, metrics and logs for any K8s application in minutes, and qryn supports it as transparently as it should acting as a polyglot backend for all datatypes, without wasting your time with complexity.
Kudos to team keyval for this fantastic project. Check out Odigos Cloud, too!
Have fun instrumenting your real Applications, and please share your comments!
🌥 qryn cloud
Try this example and many more from the comfort of your screen using qryn cloud

