


Coroot + qryn: turn telemetry into answers
turn telemetry data into answers


![]()
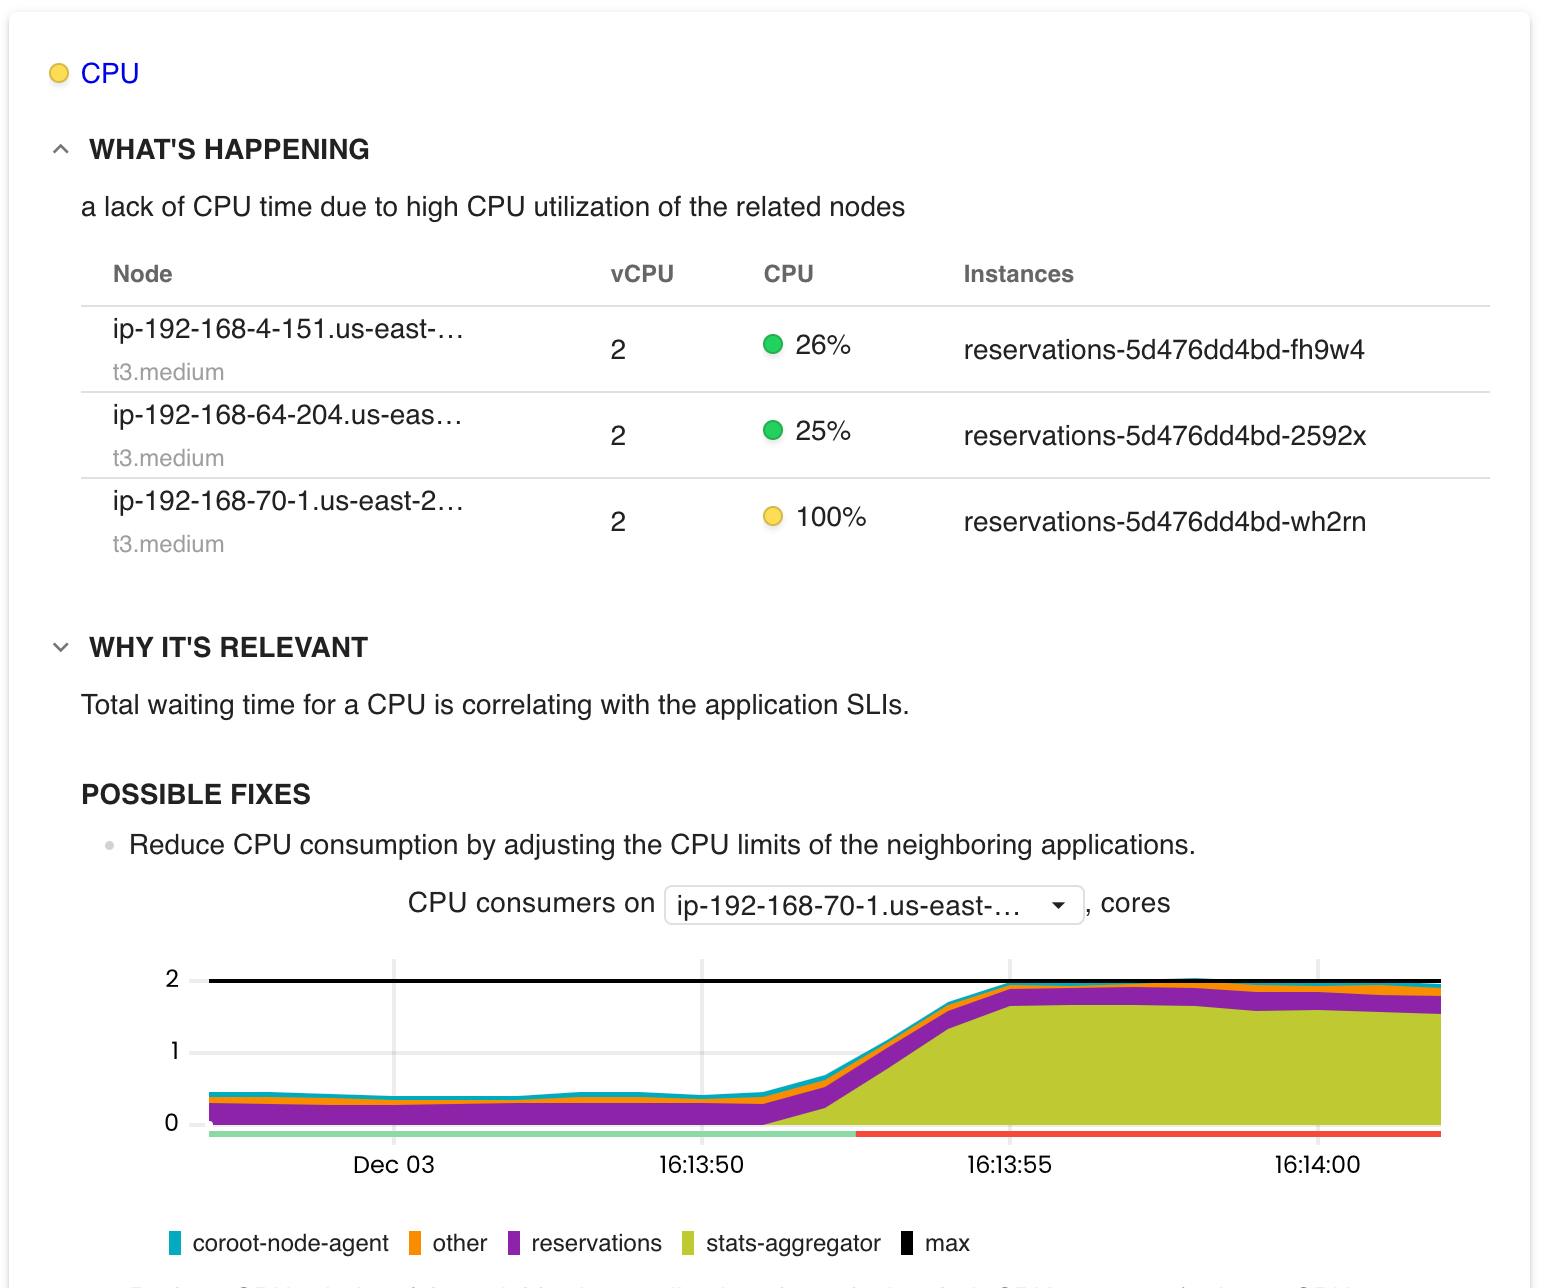
Coroot is not another observability platform with flashy dashboards and alert rules. It is an assistant, that not only detects issues in your applications but also provides you with a list of possible fixes. Each recommendation is equipped with all the relevant details to implement the fix.

Let's start with the really good news:
Since the storage backend is Prometheus remote_write, Coroot is natively compatible with qryn. There's more - Coroot Node-Agent uses eBPF and also requires zero modifications to your app stack. It's plug-and-play observability!
Let's spin up a quick tutorial to showcase this exciting combination in action!
Requirements
qryn setup or qryn.cloud account
docker, docker-compose
Usage
Clone the tutorial repository at https://github.com/metrico/qryn-coroot-tutorial
git clone https://github.com/metrico/qryn-coroot-tutorial
The provided docker-compose will spin up coroot, coroot-agent and vector scraper pointed at your qryn instance, acting as a Prometheus remote_write.
Define your QRYN_URL endpoint and let the data collection begin.
export QRYN_URL=http://qryn:3100/prom/remote/write
docker-compose up -d

Coroot
There's no Grafana this time. The Coroot interface highlights issues and weak spots in your infrastructure, providing a clear view of all components, and helping you profile, fix and prevent service outages.
Configuration
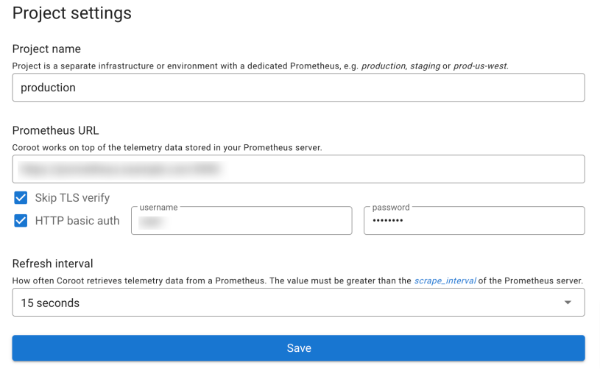
On your first usage, you will be required to create a new Project.
- use your qryn or qryn.cloud endpoint as the Prometheus URL
Usage
Metrics are emitted by the Coroot-Node-Agent and scraped by Vector into qryn. Data will automatically be populated in the Coroot User Interface.
Happy times!
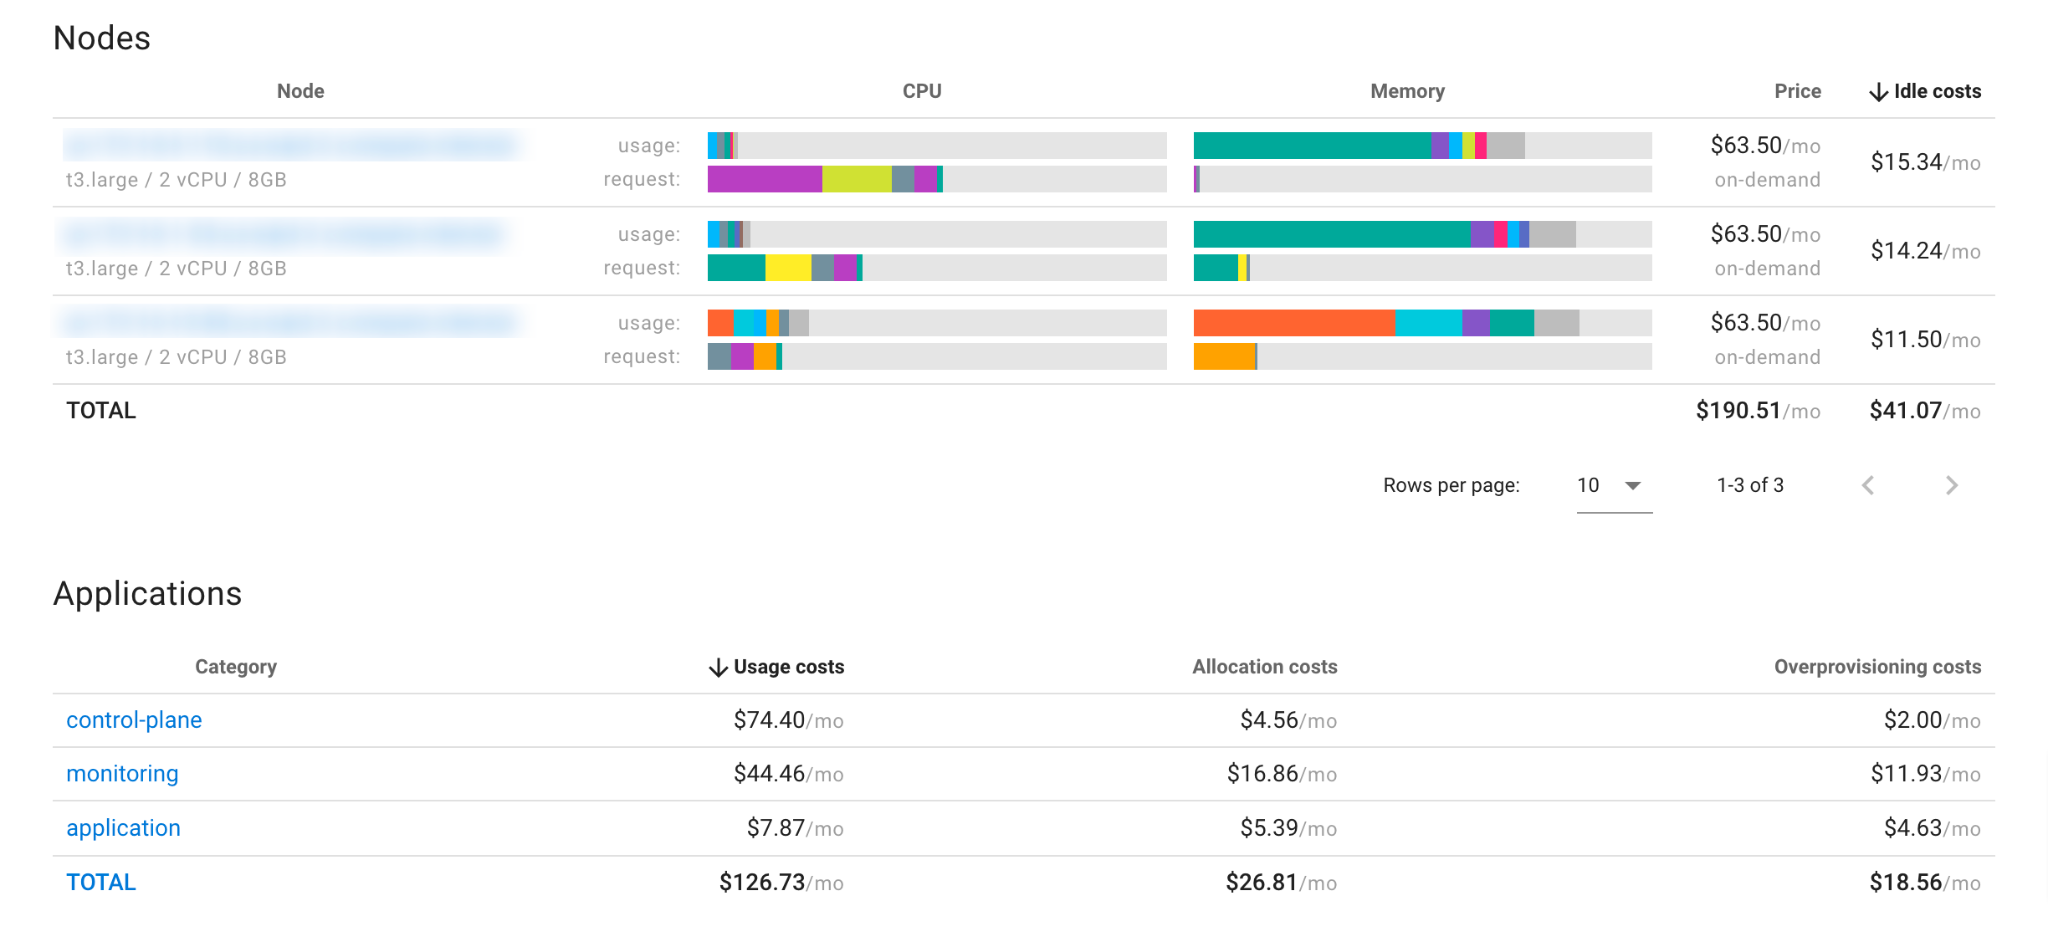
But wait, there's more! We all know the cloud is a dangerous place but fear not: Coroot can calculate your operating Cloud Costs, stored right into qryn!
That's it! 🎉
Enjoy zero instrumentation observability using Coroot + qryn!
Find more about Coroot Community Edition on the official website
Stay Polyglot with qryn!
![]()