🌥 Cloudflare Workers
Cloudflare Workers provides a serverless execution environment that allows you to create web applications and services without configuring or maintaining infrastructure by using Cloudflare’s global worldwide cloud network.
In this first episode of this seriese we will explore some useful ways to monitor our Cloudflare traffic only using Workers and our polyglot stack qryn
1. Dashflare
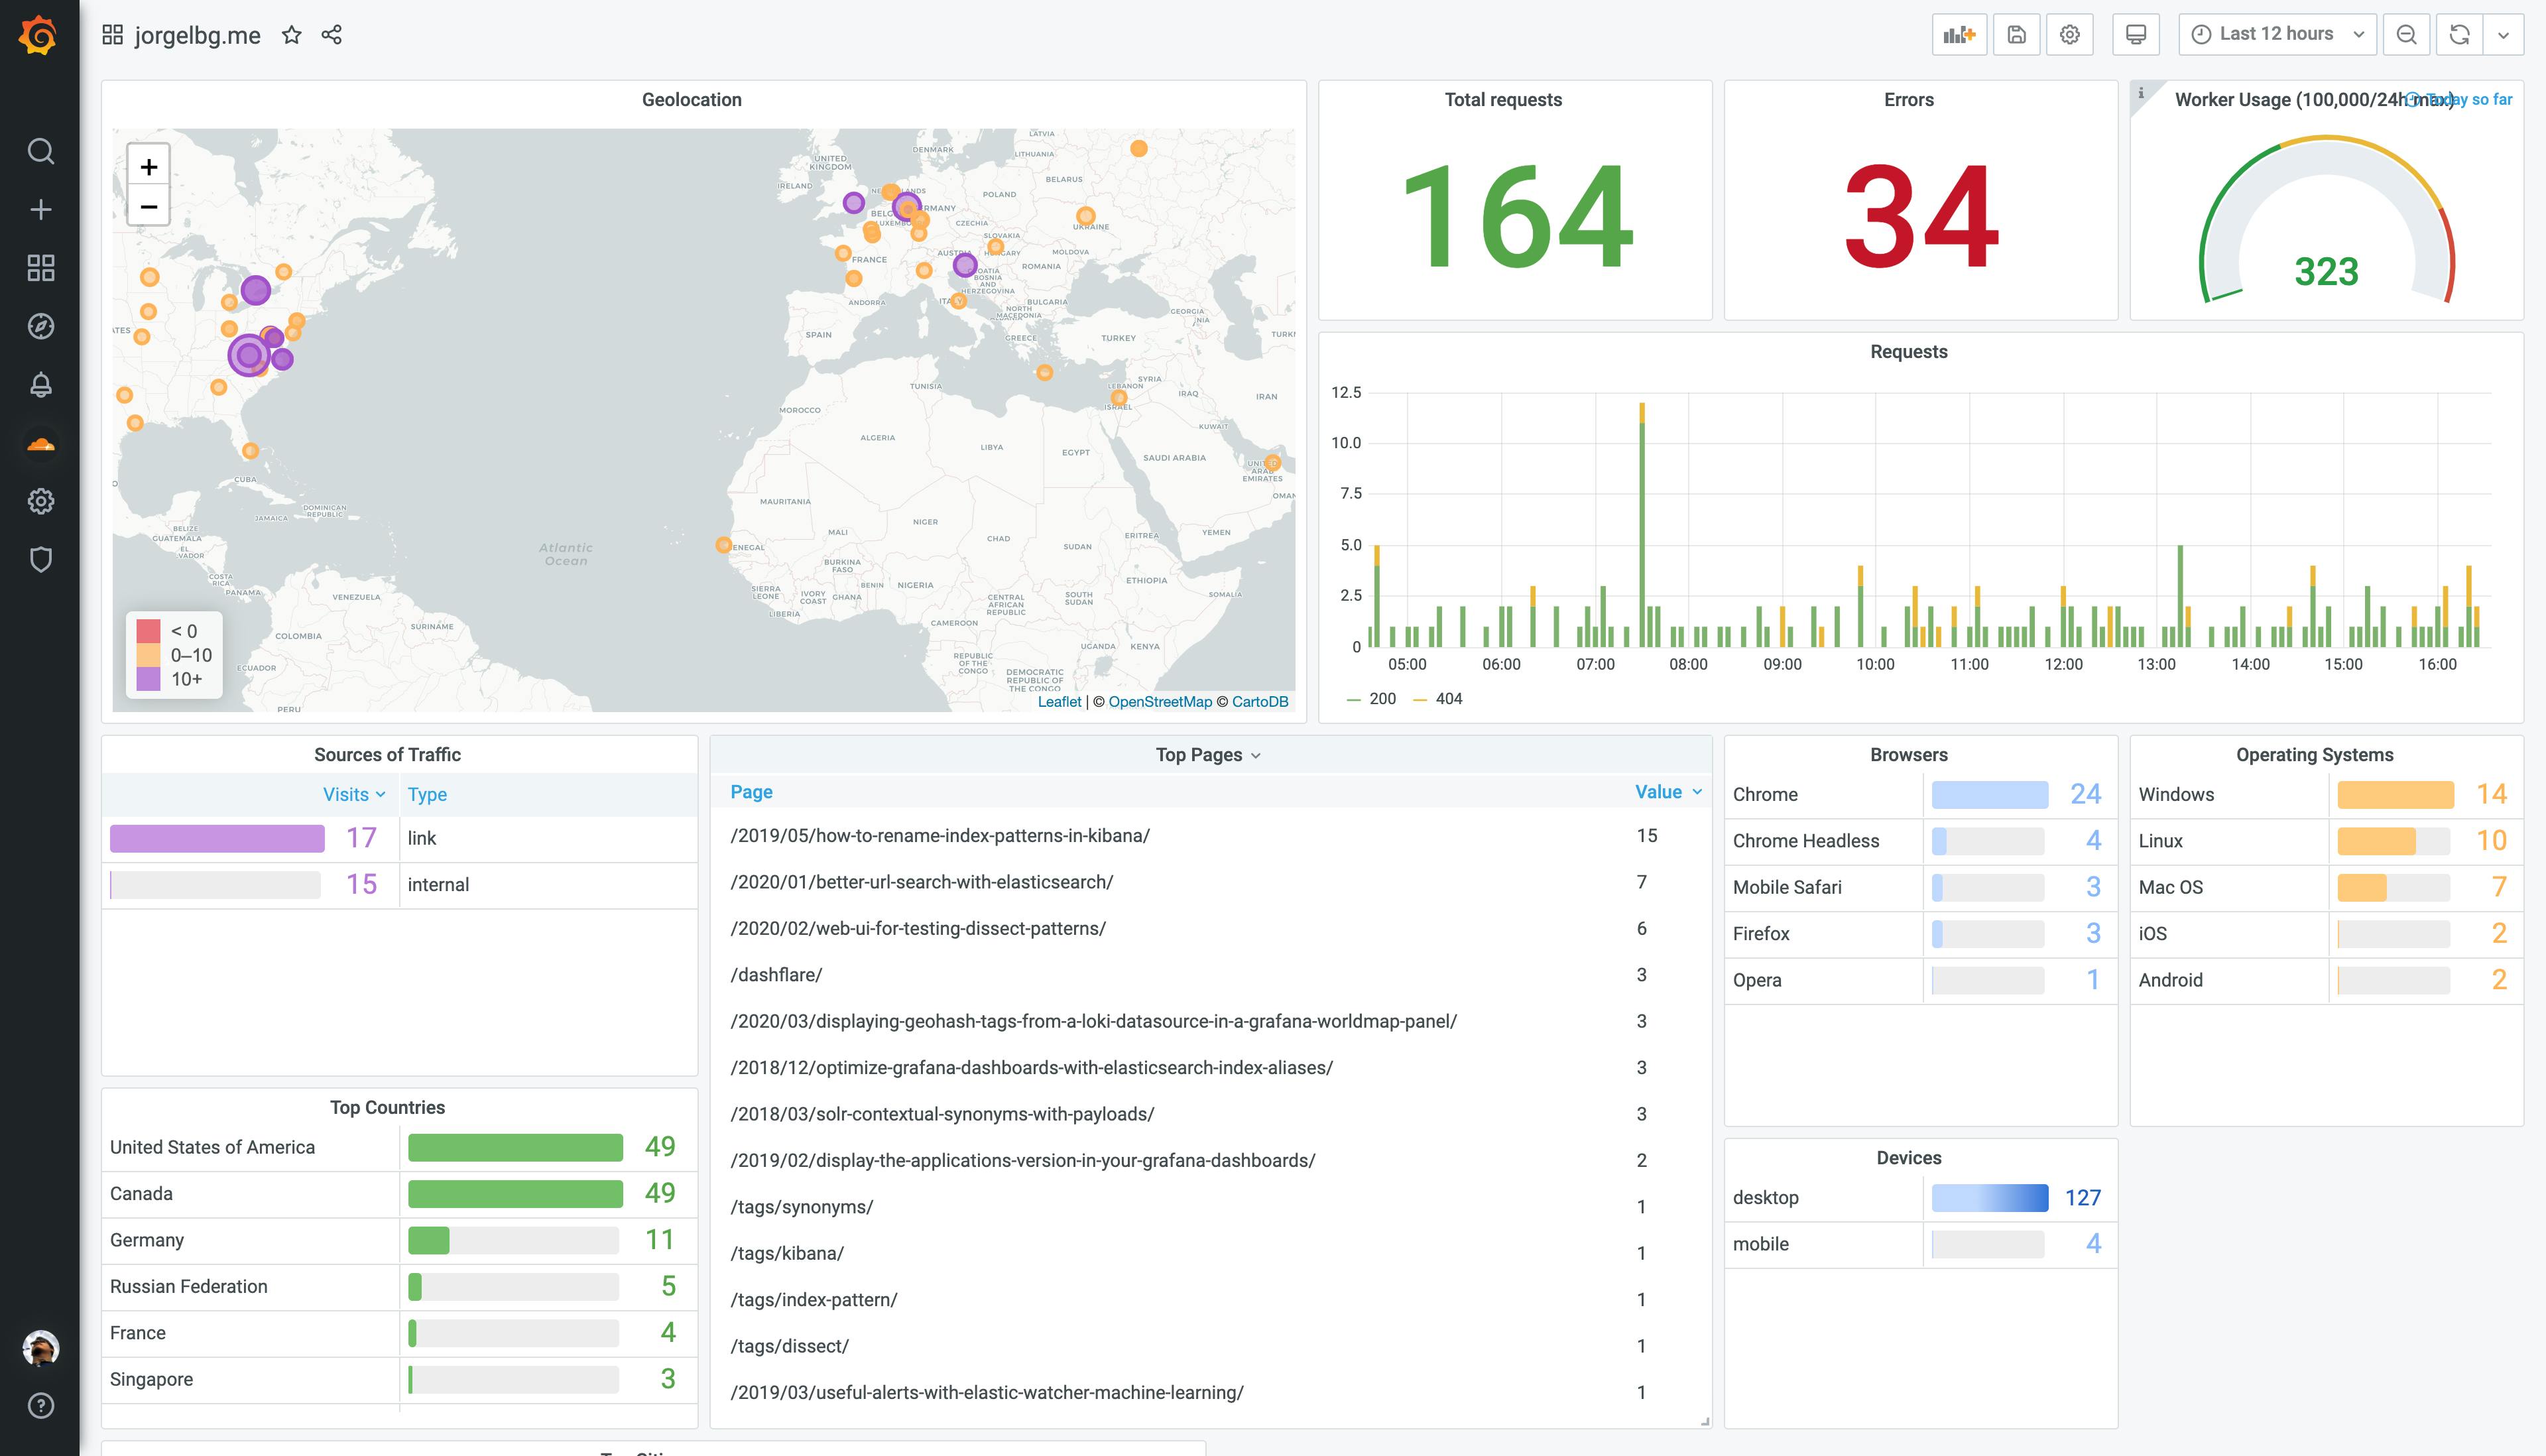
Our first option is Dashflare, a privacy first analytics solution for monitoring Cloudflare traffic using Edge Workers attached to arbitrary routes and using Grafana for Dashboards and Loki for data storage - meaning its drop-in compatible with qryn!
You can deploy Dashflare workers on your Cloudflare account in a single click:
🤠 Configuration
We just need to configure a few ENV parameter to get started:
LOKI_HOST: Secure URL for qryn (i.e qryn.glitch.me)CLIENT_ID: Set to any value. By default it is set tofakeFINGERPRINT: Its used as the key for the session id hash calculation.DOMAIN: URL of your "primary" domain on cloudflare for routes.
🗺 Routes
When the edge worker is deployed, we need to "forward" the requests from the main domain to the edge worker domain using cloudflare routes. Default routes will be generated using the DOMAIN environment variable.
🔎 Explore
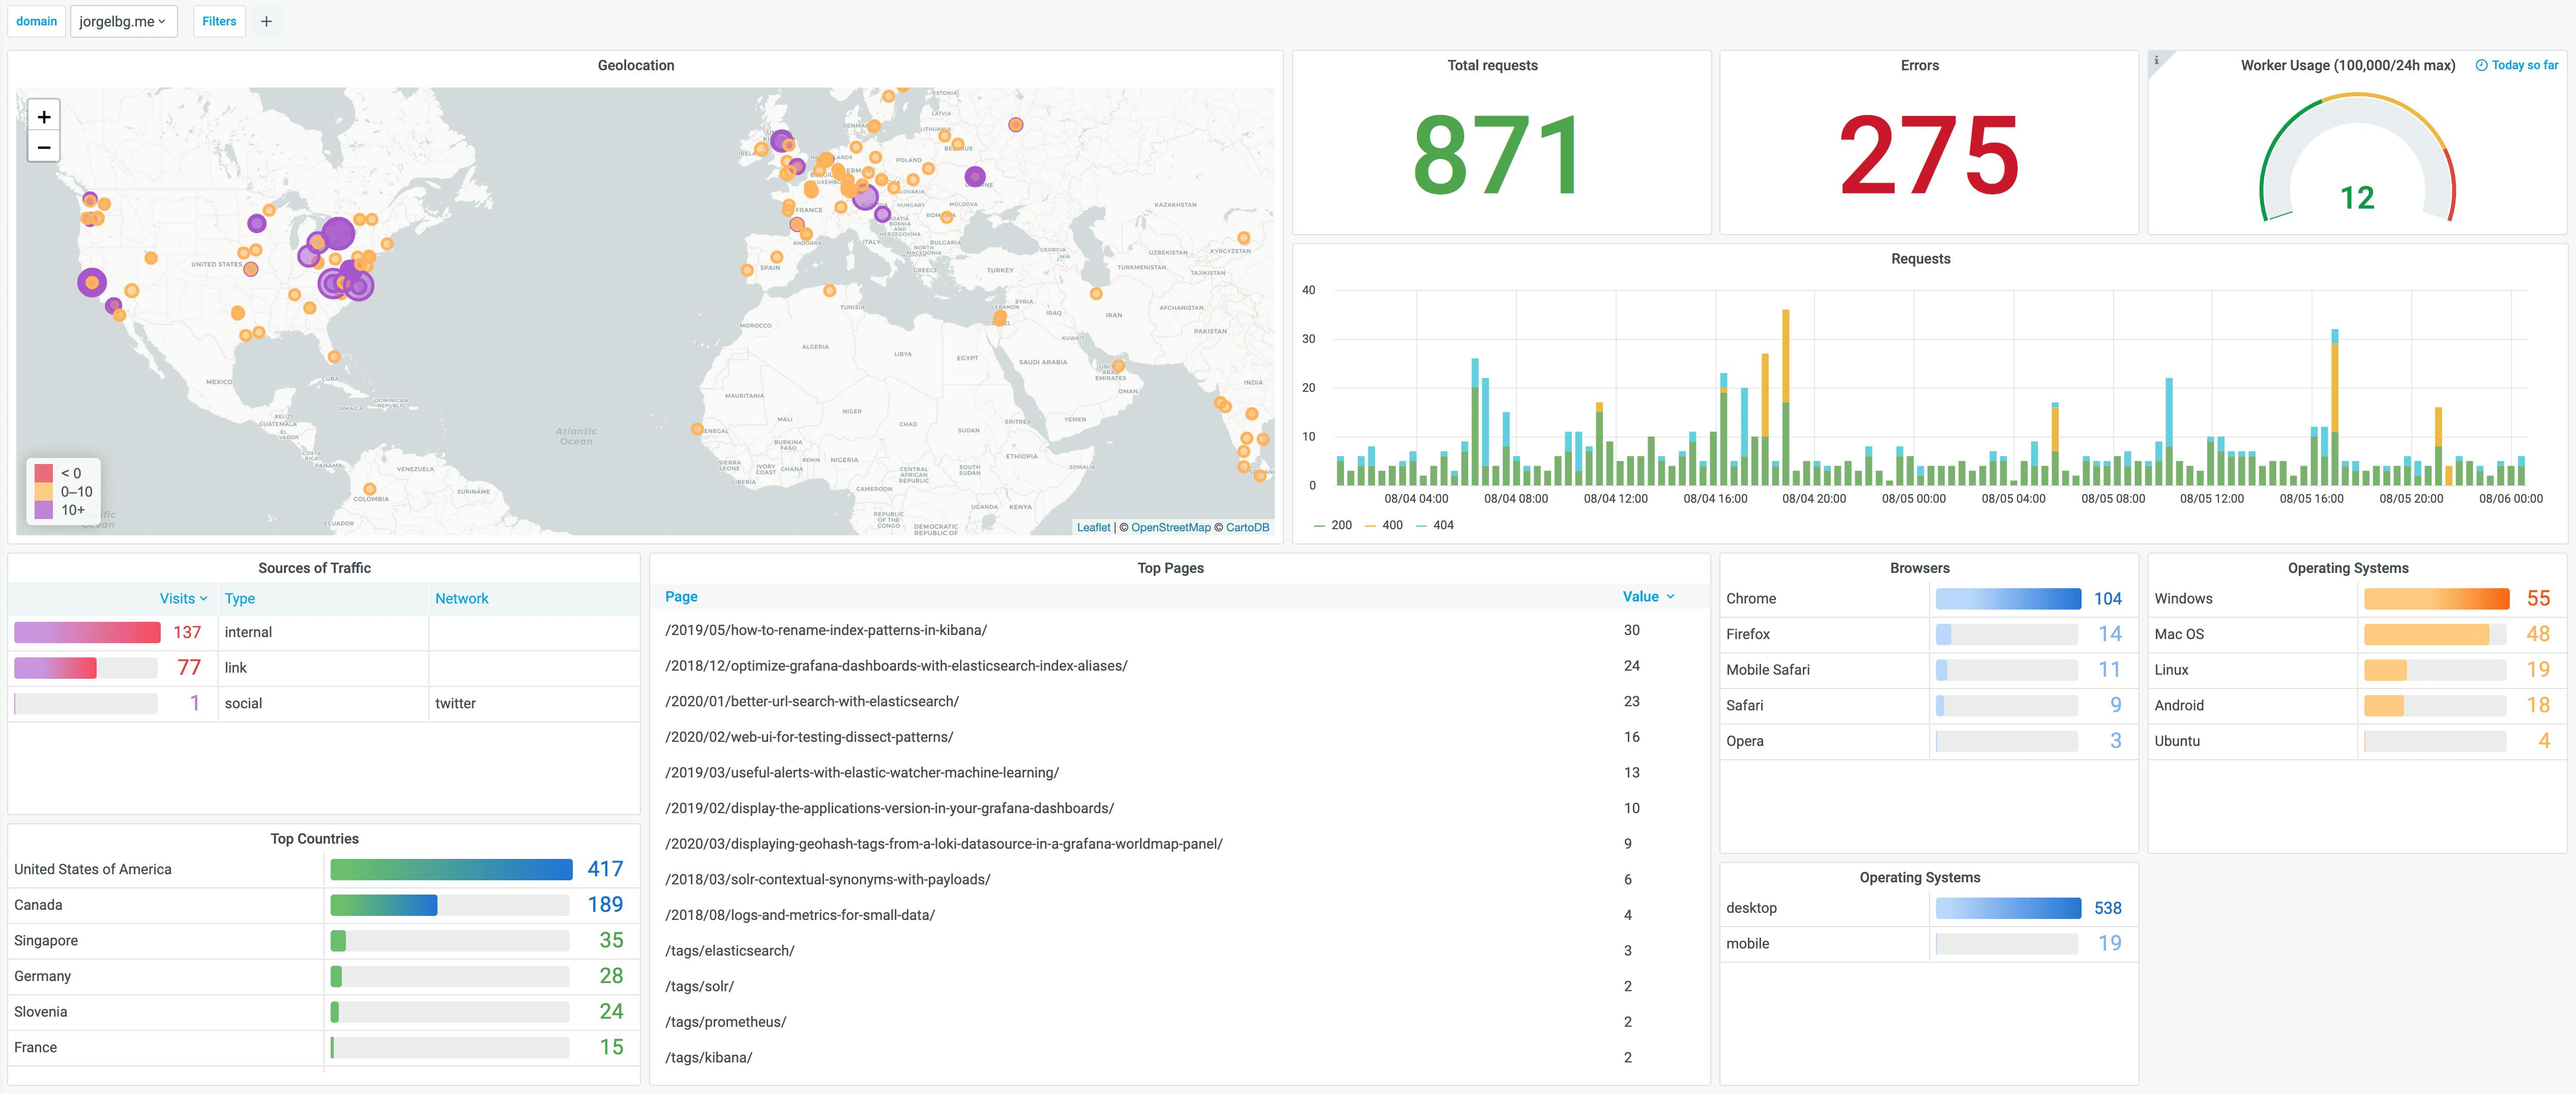
Dashflare includes a ready to use pre-built Grafana dashboard

2. Logpush / Edge Log Delivery
Our second option is Cloudflare LogPush / Edge Log Delivery which supports pushing logs to storage services and log management providers such as qryn.
Edge Log Delivery can be configured to deliver logs directly to your destination without first flowing through either of our US or EU core data centers. This means that your logs are delivered from data centers inside your selected region to your destination.
🤠 Configuration
Enable a supported destination using the Cloudflare Dashboard.
qryn supports the Datadog and New Relic formats and API for ingesting logs.
Enable Logpush to Datadog via the dashboard.
Log in to the Cloudflare dashboard.
- Select the domain you want to use with Logpush.
- Go to Analytics > Logs.
- Click Connect a service.
A modal window opens where you will need to complete several steps.
Select the
datasetanddata fieldsto include in your logs.Select Datadog as the Delivery target.
Enter or select the following destination information:
- Datadog/qryn URL Endpoint, ie:
https://qryn:3100/v1/input - Click Validate access + Save and Start Pushing to enable Logpush.
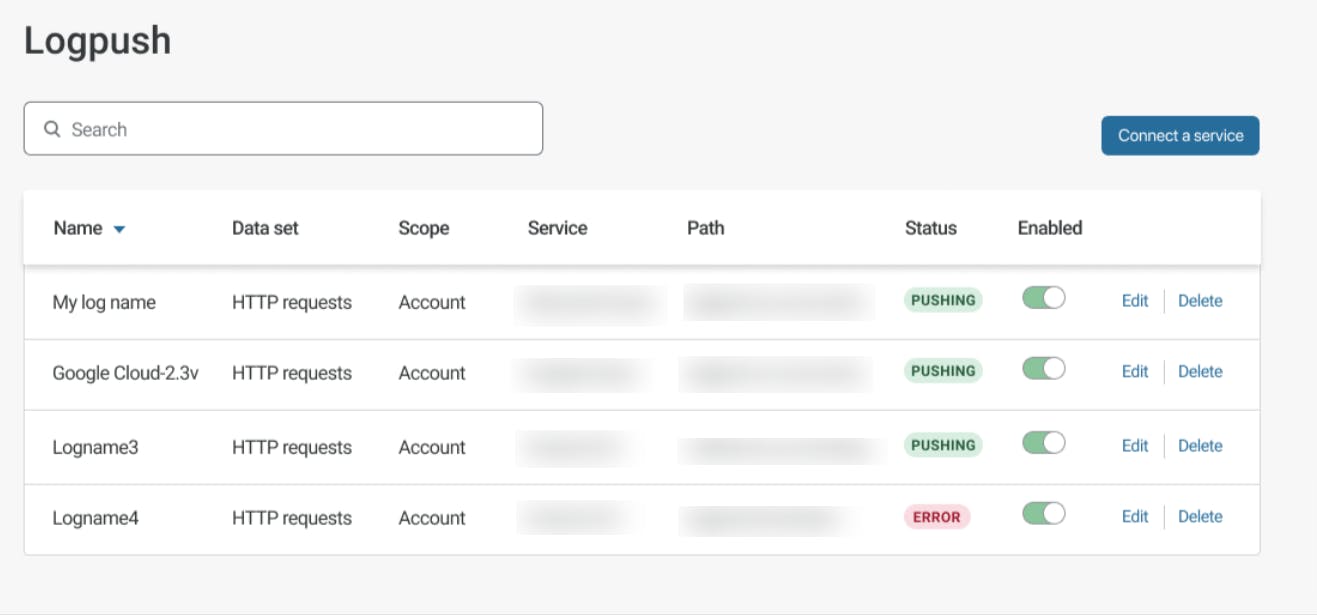
Once connected, check status using
Logs > Logpush.- Datadog/qryn URL Endpoint, ie:
🔎 Explore
Cloudflare events can be explored and using the powerful LogQL query language
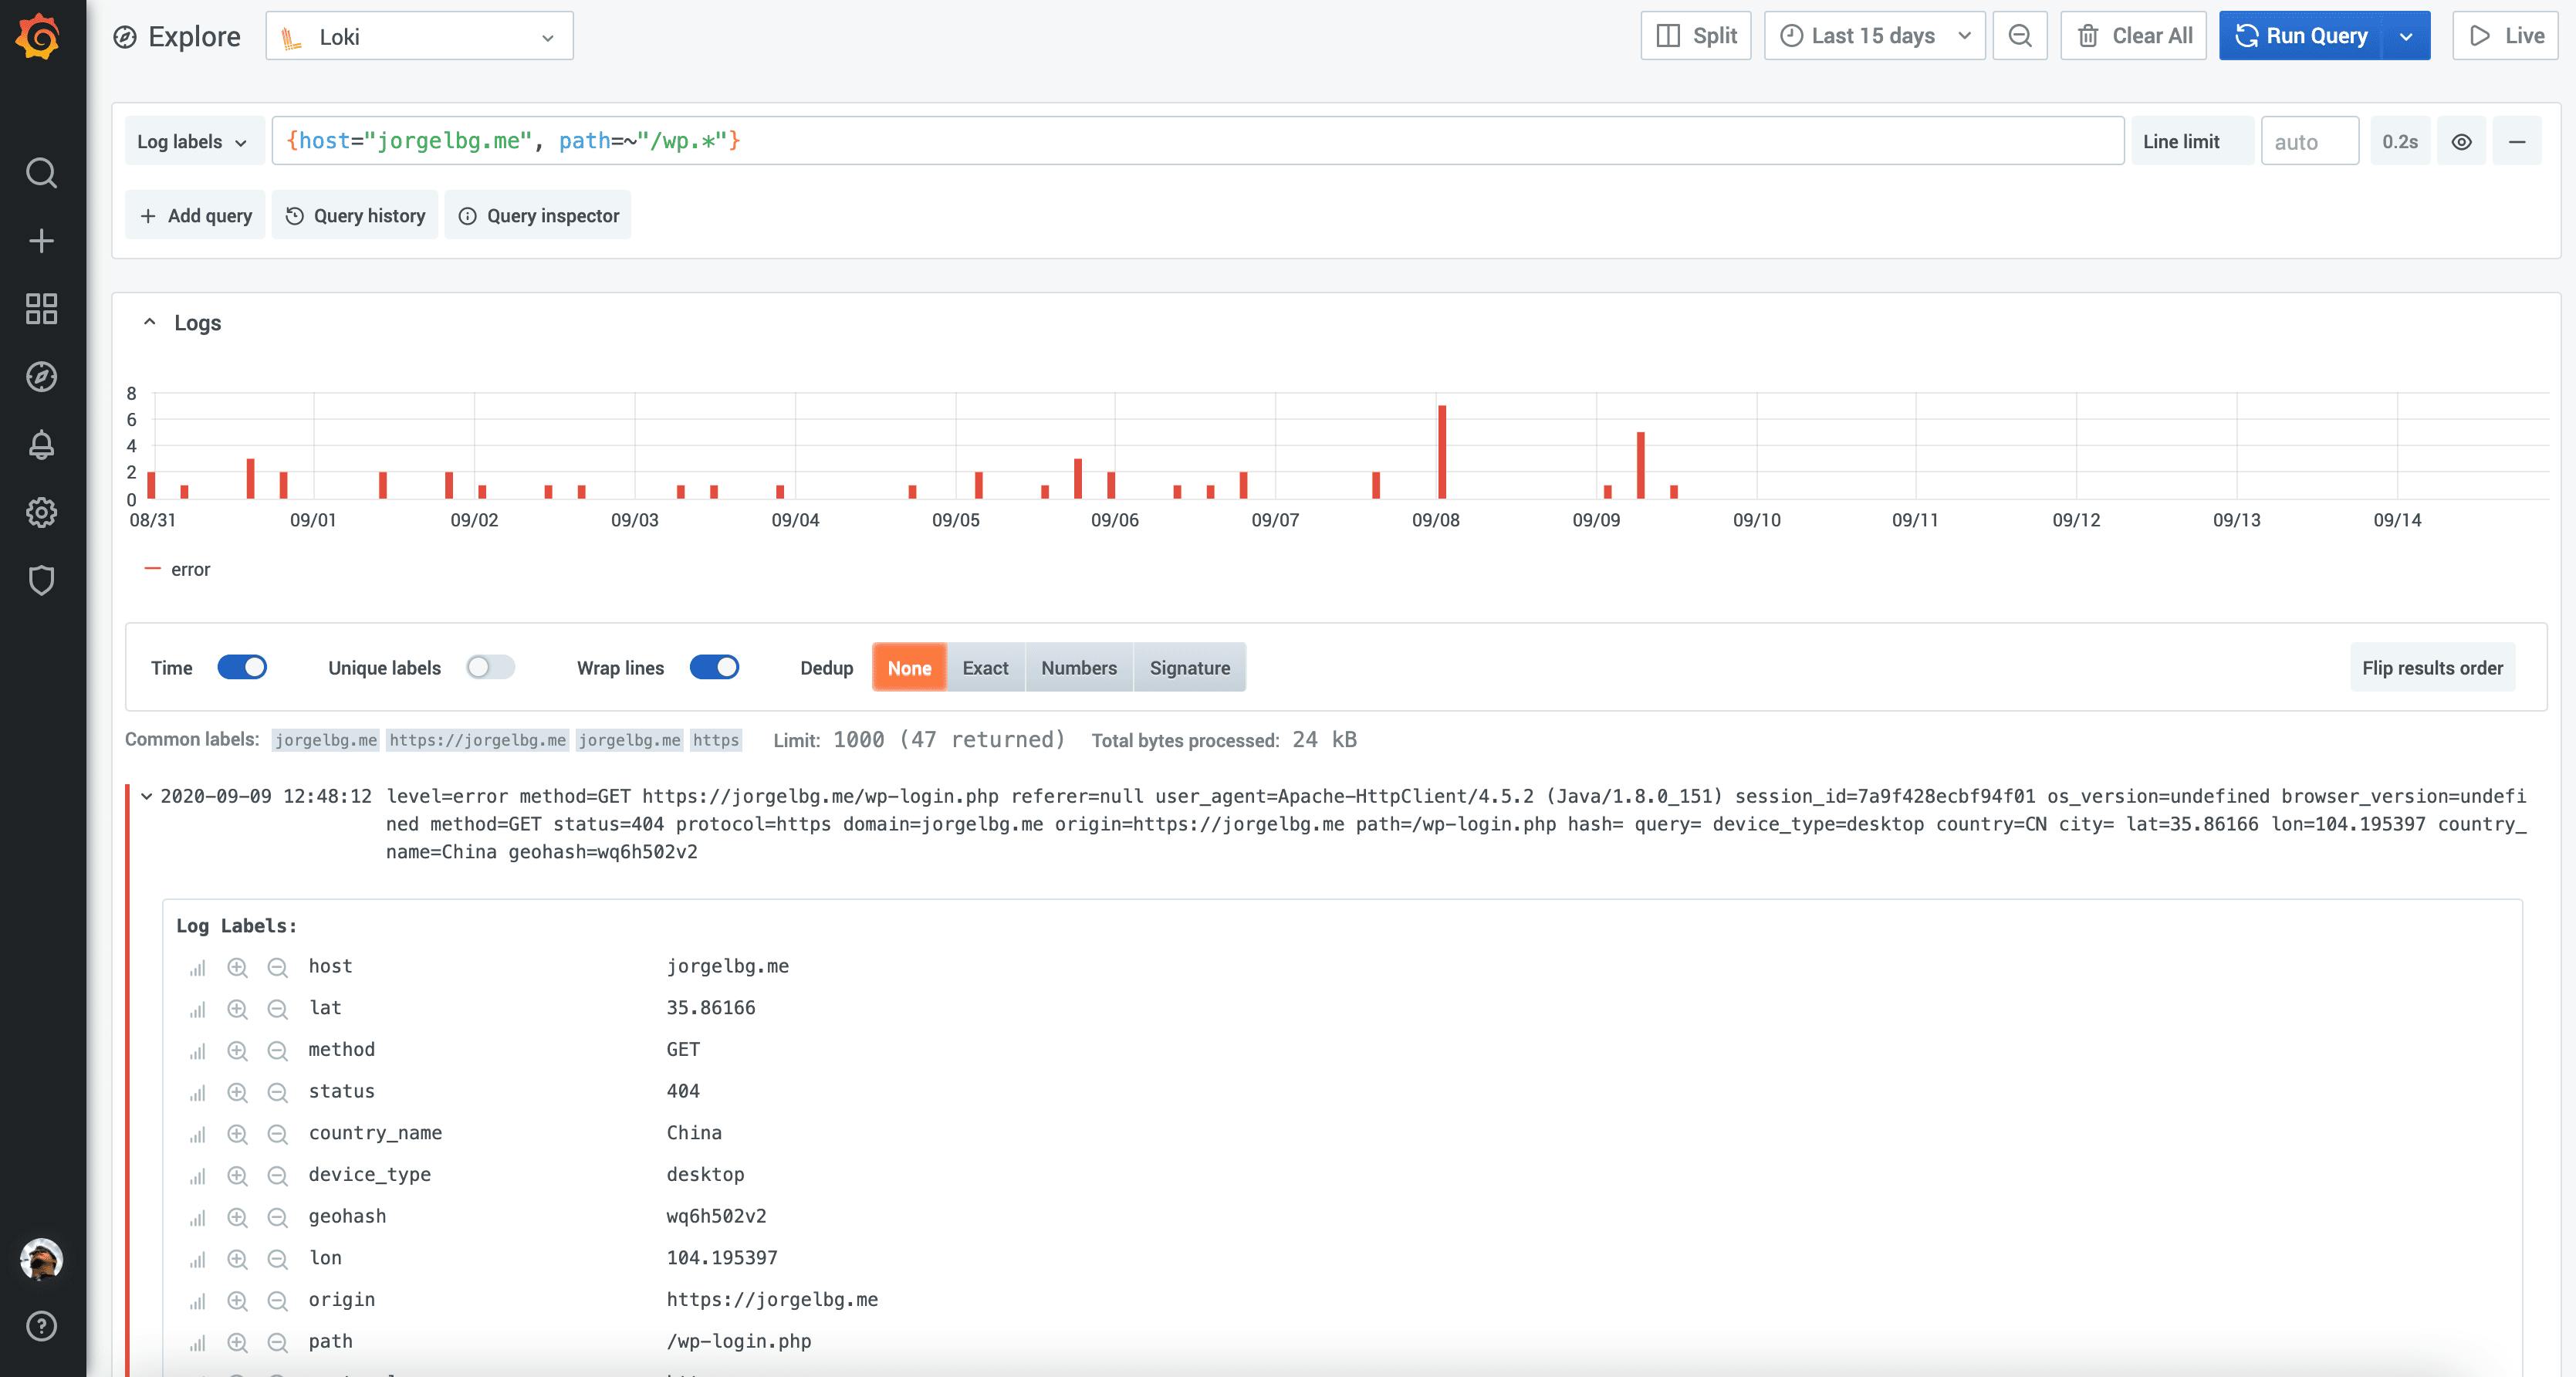
There's no preset Grafana dashboard yet (any takers?) but using the Datadog dashboards as reference we can easily track and display:
- Threats (by type, threats by country)
- Requests (requests, cache state, top countries, content types)
- Bandwidth (bandwidth, encryption, cache states)
- Caching (hit rate, request caching rate over time)
- DNS (queries, response time, top hostnames by type, stale vs. uncached)
- HTTP responses status errors
- Page views, Bot Traffic, Search Engines
3. DIY Worker
Cloudflare Workers are fun and easy to develop, with lots of examples available.
You can easily build your own custom solution in a few lines of code. A good reference is boscaiolog which provides a micro API to stream logs, metrics and telemetry in just a couple lines of code.

Conclusion
qryn and its polyglot core can transparently ingest Cloudflare logs.
Since the forwarding is performed by Cloudflare Workers and LogPush, no change are required to the website or code of your monitored webapplication.
Try this example and many more from the comfort of your screen using qryn cloud


