
Cloudflare Log Push with qryn.cloud
Total Cloudflare Observability powered by Gigapipe


Cloudflare Logpush
Cloudflare can trace all your request or event logs to qryn.cloud using Logpush, which can be configured via the Cloudflare dashboard or API for paid accounts.
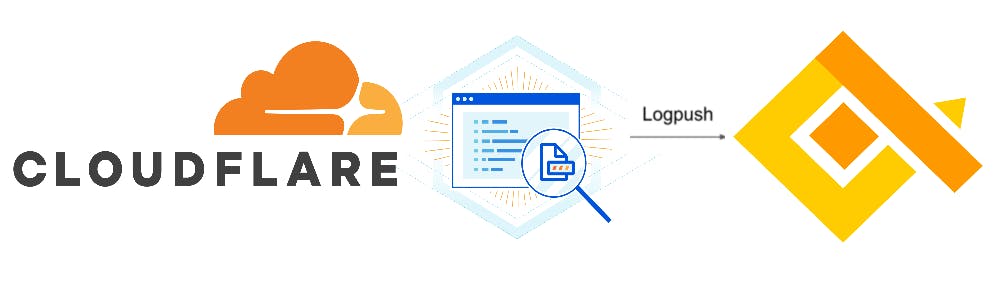
Using qryn as your Logpush endpoint is straightforward to set up and allows you to ingest, query and visualize all your Cloudflare logs in just seconds using the Datadog compatible APIs of our polyglot observability stack, proudly part of the first cohort of startups selected to participate the Cloudflare Workers Launchpad program!
Requirements
Cloudflare paid account
qryn.cloud paid account or free trial on gigapipe.com
Configuration
To set up Cloudflare's Logpush feature, navigate to your Cloudflare dashboard.
Find the 'Analytics & Logs' Section.
Inside you will find Logs, which have recently been made available to any paid user of Cloudflare (previously for Enterprise only), making it even easier to monitor Workers, Firewalls, Gateway and Audit Logs across all zones and regions.
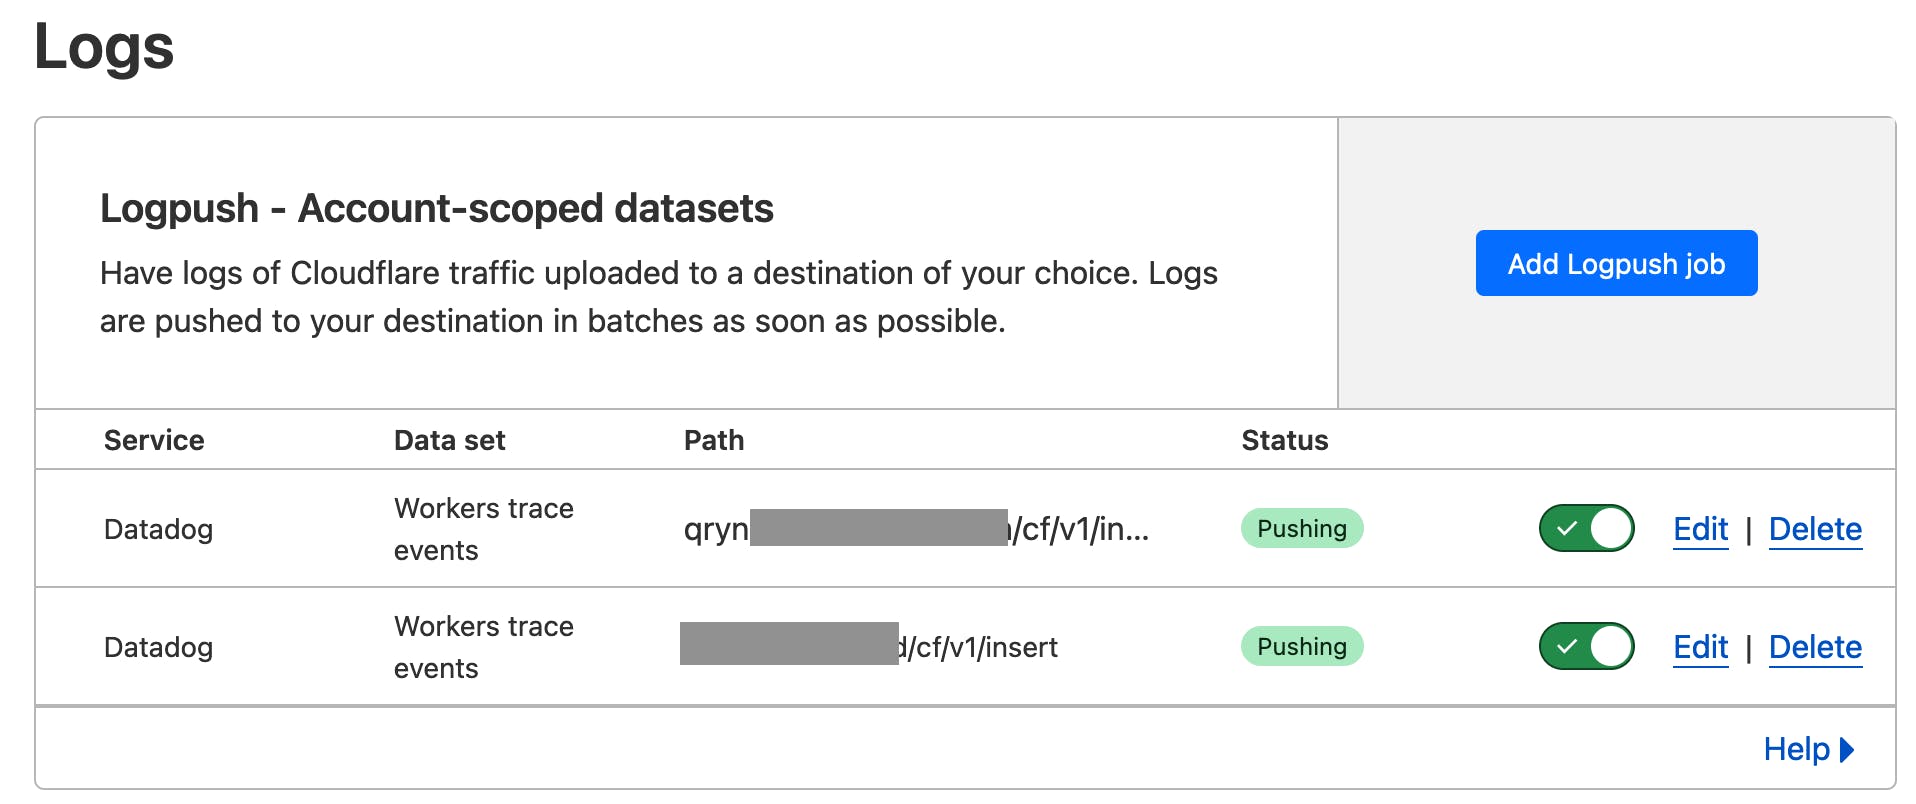
Click 'Add Logpush Job' and select the type of Logs you want to forward to qryn
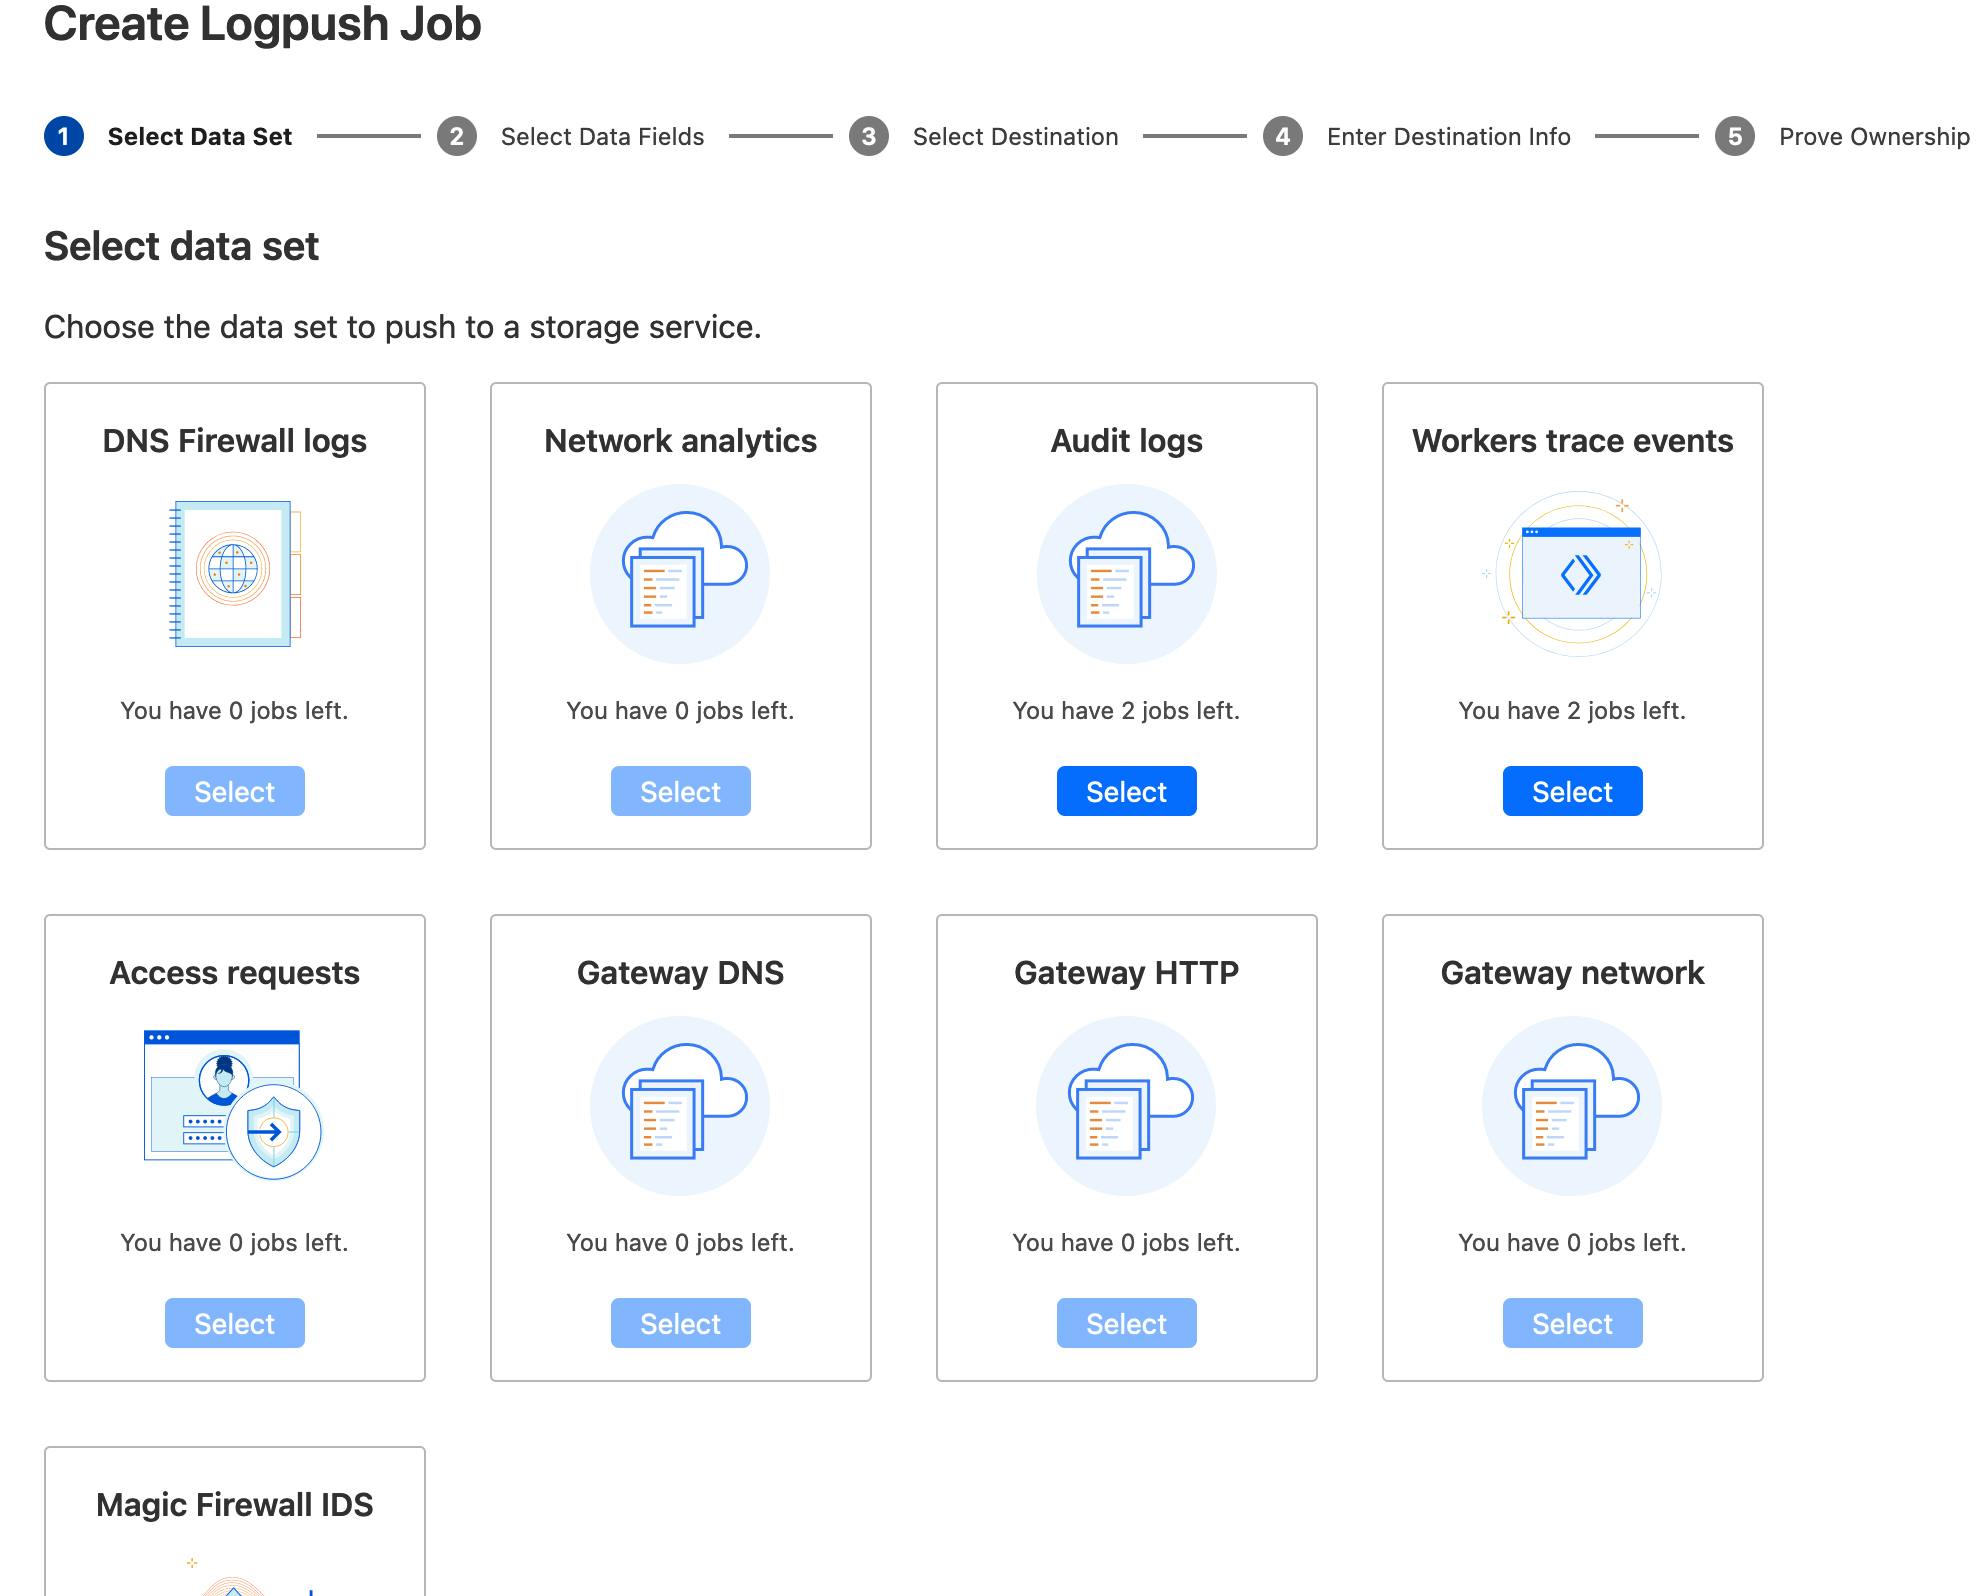
For this example, we will use Workers Trace Events, but any available dataset can be configured and used based on your specific needs.
Click 'Select' and scroll to the bottom to click 'Next'.
Cloudflare lets you select which types and frequency of events you want to monitor.
Check out the "Advanced Settings" at the bottom of the selector to activate and configure the desired sampling percentages.
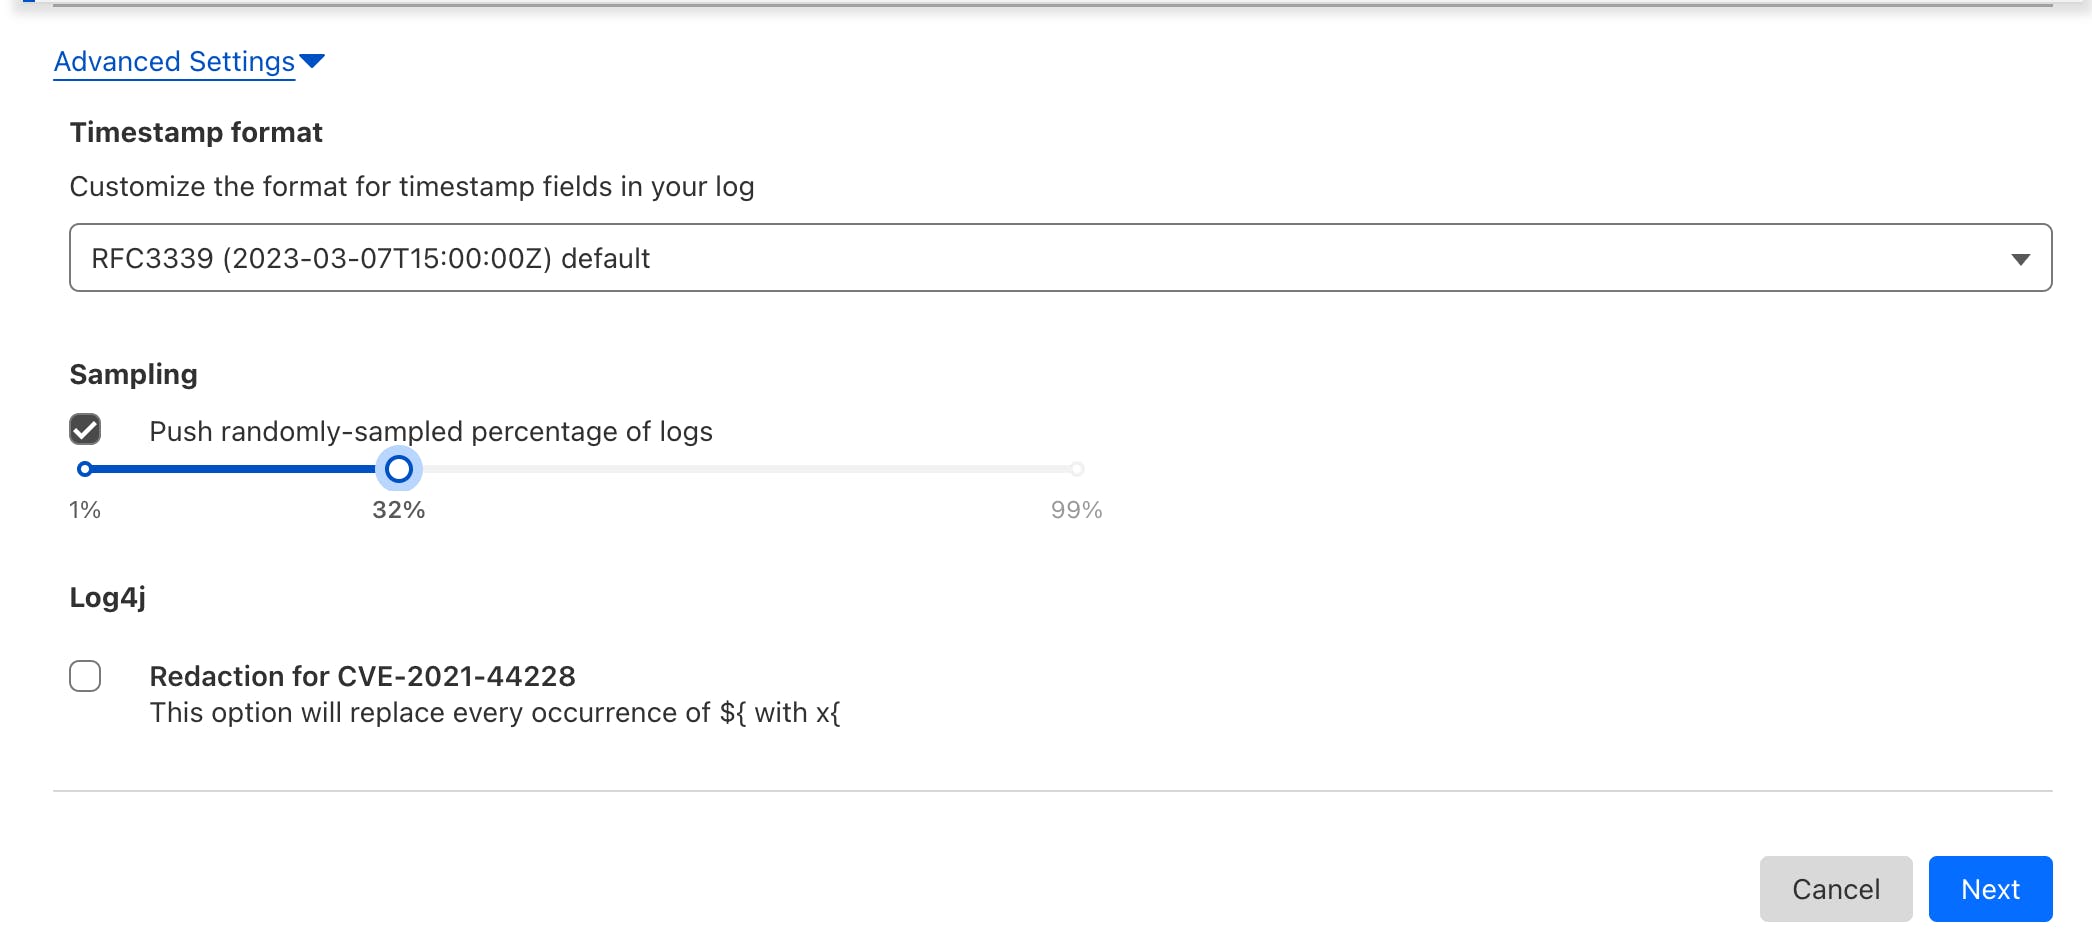
Once you have all configured, click 'Next' to proceed to the receiver selection.
Select the "Datadog" receiver and click 'Next'.
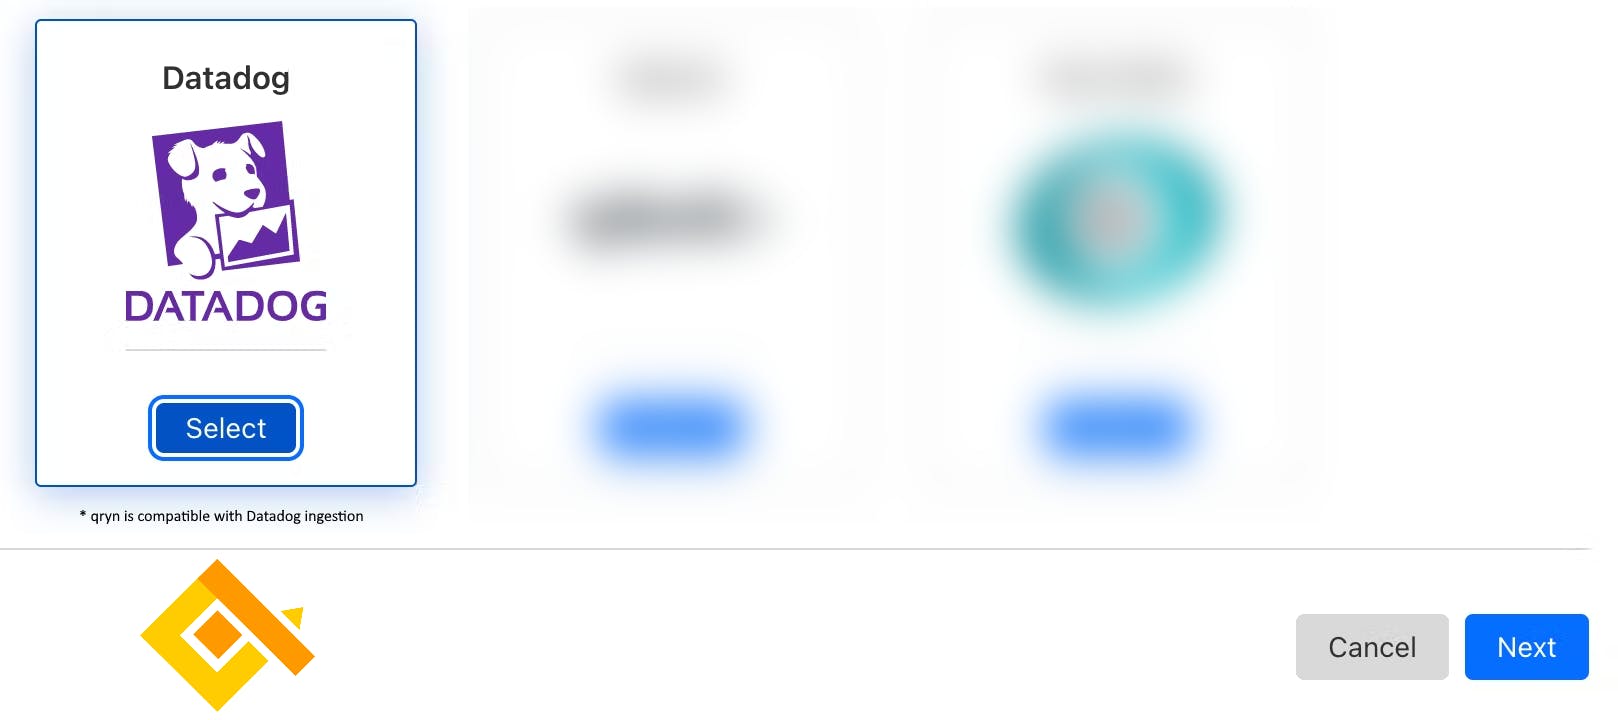
💡 Why Datadog? qryn.cloud is transparently compatible with Datadog ingestion.
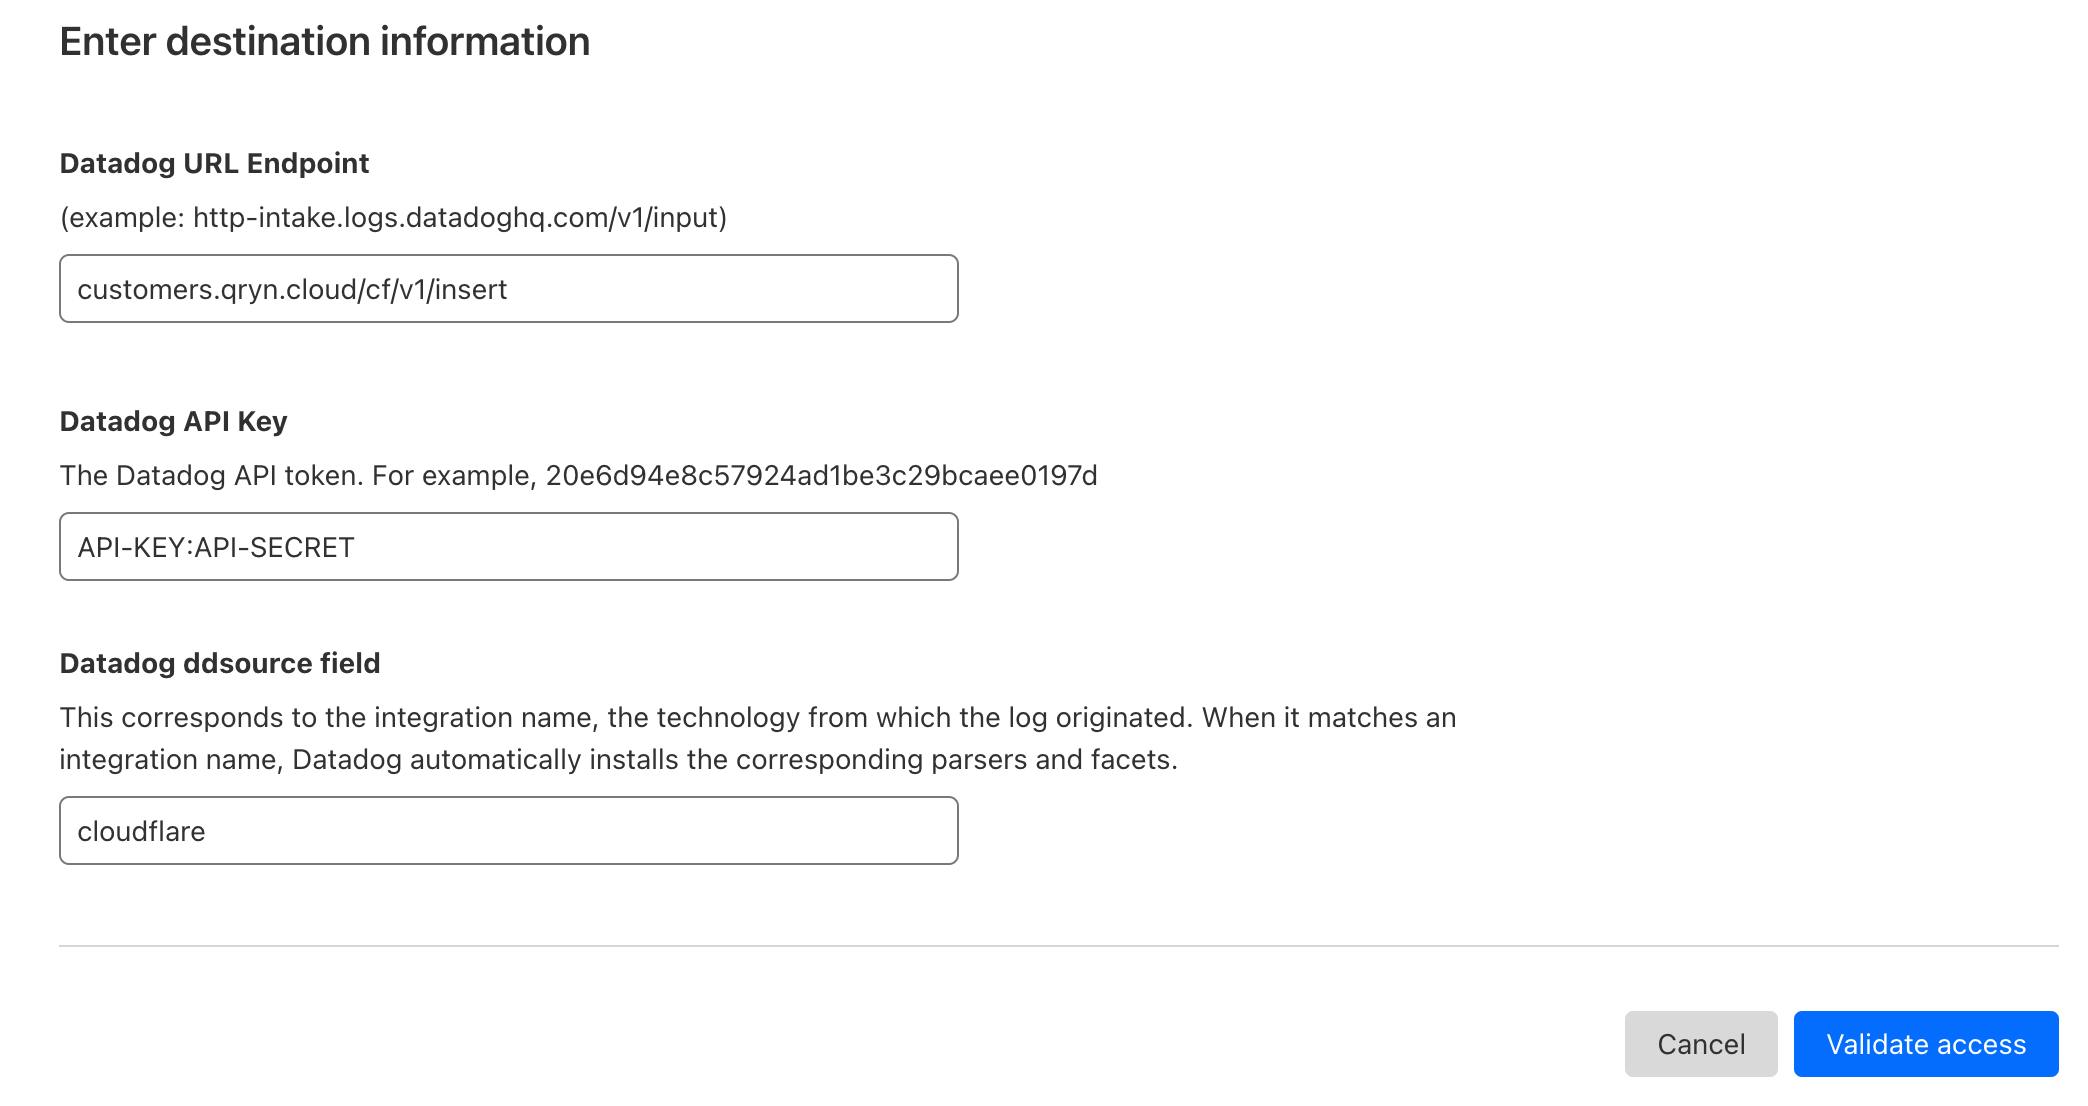
Datadog URL Endpoint
Add the destination information, based on your qryn.cloud account endpoint + the /cf/v1/insert path. This will make sure your data ends up in the right place.
Example: myaccount.qryn.cloud/cf/v1/insert
IMPORTANT: Host + path only. DO NOT include the protocol (
https://)
Datadog API Key
Use qryn.cloud authentication API-Key and Secret separated by a semicolon (:)
Example: YOUR_API_KEY:YOUR_API_SECRET
Datadog ddsource field
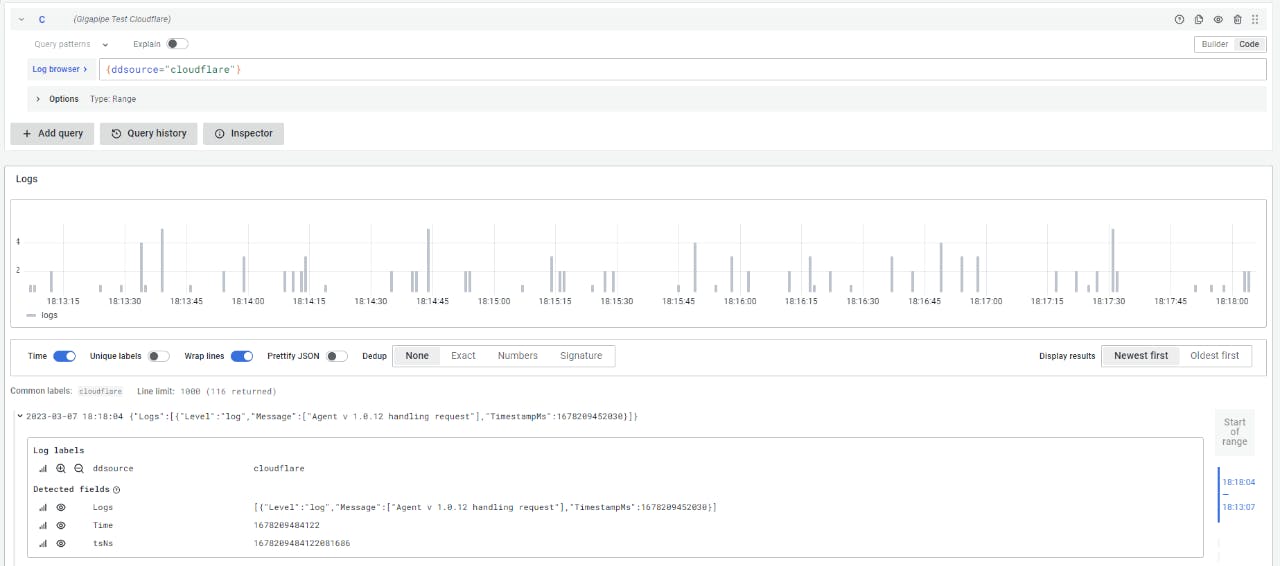
The ddsource field will be converted into a label/tag. For example, using "cloudflare" will allow you to search using the Logql selector '{ddsource="cloudflare"}'.
Once ready, click on the 'Validate access' button to confirm the last page and you are all set to receive your Cloudflare logs with the rest of your observability data.
Result
You can instantly query your Cloudflare logs using LogQL and the Gigapipe Grafana instance automatically provided and configured with each qryn.cloud account:
{ddsource="cloudflare"}
Alternatives
💡 Prefer using your own Cloudflare Workers to handle Logpush inserts qryn.cloud or qryn.dev using LogQL? Here's how 👈
💡 How about sending our logs and telemetry directly from our Apps without adding tons of dependencies and libraries? Check out Boscaiolog 👈
Conclusion
Just a few clicks and you are all set, ready to gain full observability over your Cloudflare Workers, Firewalls, Gateway and Audit Logs across all zones and regions alongside the rest of your observability data, instantly available through the power of LogQL and qryn on top of ClickHouse and its columnar superpowers.
Next: add Logs, Metrics and Traces for end-to-end visibility using qryn's polyglot API to ingest Loki, Prometheus, Opentelemetry, InfluxDB, Elastic and many more formats.