
AWS Fargate Observability with qryn.cloud
AWS Serverless Observability made simple!


AWS Fargate is a serverless, pay-as-you-go compute engine that lets you focus on building and operating applications without managing servers.
AWS Fargate works with Amazon ECS and EKS to run containers without having to manage servers or clusters of Amazon EC2 instances. Users no longer have to provision, configure, or scale clusters of virtual machines to run containers, removing the need to choose server types or decide when to scale or optimize clusters.
⚡ Serverless Monitoring Challenge
Due to their dynamic nature, Serverless setups can be challenging to monitor and troubleshoot without a centralized and well-coordinated observability solution. Once things scale up, it gets incrementally harder to comprehend how all workloads are performing and how they are utilizing and affecting your AWS resources over time.
Fear not! Here's a collection of qryn-compatible agents to get you started in minutes!
Requirements:
AWS Fargate
qryn.cloud account or free trial
Collector Agent of choice:
Grafana Agent from Grafana
Telegraf from Influxdata
Vector from Datadog
![]()
Grafana Agent
Grafana Agent collects and sends metrics, logs, and traces from your Fargate instances directly to qryn.cloud and allows users and administrators to instantly observe the critical metrics, logs, and traces using the onboard Grafana.
Since qryn is transparently compatible with Loki, Prometheus and Tempo APIs (out of many more) using ClickHouse storage, everything just works out of the box!
Steps:
Configure Grafana Agent YAML to send Logs, Metrics and Traces to qryn
Deploy Grafana Agent on your Fargate cluster as a sidecar
🎉You're done! No need to worry about any extra steps or configuration options after configuring your Grafana Agent YAML file - the agent will deliver metrics, logs, and traces to your qryn stack automatically.

Telegraf
Telegraf is a popular observability agent from InfluxData, supporting multiple native qryn API standards such as Influx Line Protocol, Loki, Prometheus and others.
Telegraf Agents can collect, generate and sends metrics, logs, and traces from your instances and supports writing directly to qryn.cloud.
The Amazon ECS Fargate compatible input plugin automatically uses the Amazon ECS metadata and stats v2 or v3 API endpoints to gather stats on running containers.
# Read metrics about ECS containers
[[inputs.ecs]]
  ## ECS metadata url.
  # endpoint_url = ""

  ## Containers to include and exclude. Globs accepted.
  ## Note that an empty array for both will include all containers
  # container_name_include = []
  # container_name_exclude = []

  ## Container states to include and exclude. Globs accepted.
  ## When empty only containers in the "RUNNING" state will be captured.
  ## Possible values are "NONE", "PULLED", "CREATED", "RUNNING",
  ## "RESOURCES_PROVISIONED", "STOPPED".
  # container_status_include = []
  # container_status_exclude = []

  ## ecs labels to include and exclude as tags.  Globs accepted.
  ## Note that an empty array for both will include all labels as tags
  ecs_label_include = [ "com.amazonaws.ecs.*" ]
  ecs_label_exclude = []

[[outputs.influxdb_v2]]
  urls = ["https://account.qryn.cloud/influx/api/v2/write"]
  token = "$AUTH_TOKEN"
  organization = "example-org"
  bucket = "example-bucket"
Steps:
Configure Telegraf to send ECS Telemetry data to qryn
Deploy Grafana Agent on your Fargate cluster as a sidecar
🎉You're done! No need to worry about any extra steps or configuration options. The Telegraf agent will deliver metrics, logs, and traces to your qryn stack automatically.

Vector
Vector is a polyglot observability agent from Datadog, supporting multiple qryn API standards such as Loki, Prometheus and others, and packaged as a single binary with no dependencies, no runtime, and memory safe. Vector Configuration can be performed using YAML, TOML or JSON format.
Let's configure Vector to look after our AWS Fargate containers:
Steps:
Configure Vector for AWS ECS and Fargate Metrics with output to qryn
Deploy Vector on your Fargate cluster as a sidecar
[sources.fargate]
type = "aws_ecs_metrics"

[sinks.qryn_metrics]
type = "prometheus_remote_write"
inputs = [ "fargate" ]
endpoint = "https://account.qryn.cloud/api/v1/write"
auth.strategy = "basic"
auth.user = "cloud_username"
auth.password = "cloud_token"

[sinks.qryn_logs]
type="loki"
inputs = ["fargate"]
endpoint = "https://account.qryn.cloud"
auth.strategy = "basic"
auth.user = "cloud_username"
auth.password = "cloud_token"
compression = "none"
    [sinks.qryn_logs.labels]
    forwarder = "vector"
    event = "{{ facility }}"
    type = "fargate"
    [sinks.qryn_logs.encoding]
    codec = "json"
🎉That's it! No need to worry about any extra steps or configuration options - Vector will deliver metrics, logs, and traces to your qryn backend automatically.
Data & Dashboard Usage
Use our polyglot APIs to access your data using Grafana Loki, Prometheus and Tempo datasources without requiring any additional plugin or modification.
Once your data is collected, you're ready to start building your queries and panels - or download and deploy the Grafana Serverless Health Dashboard *
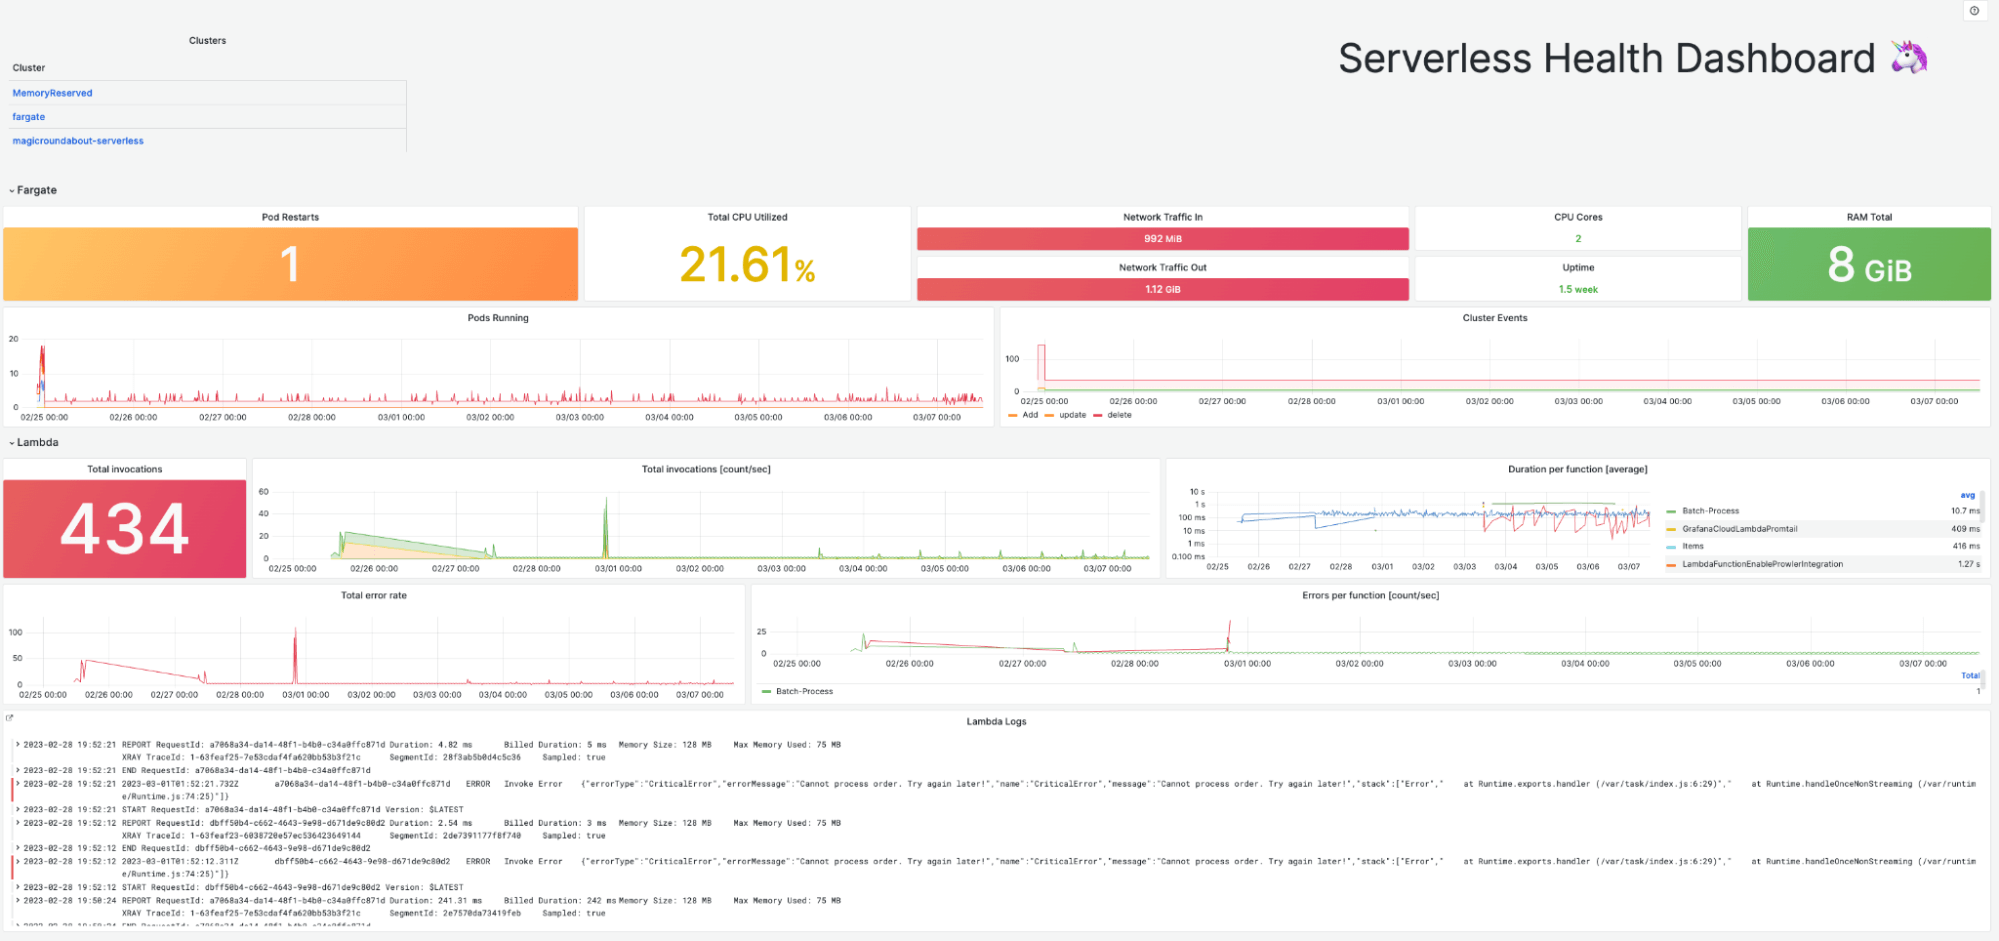
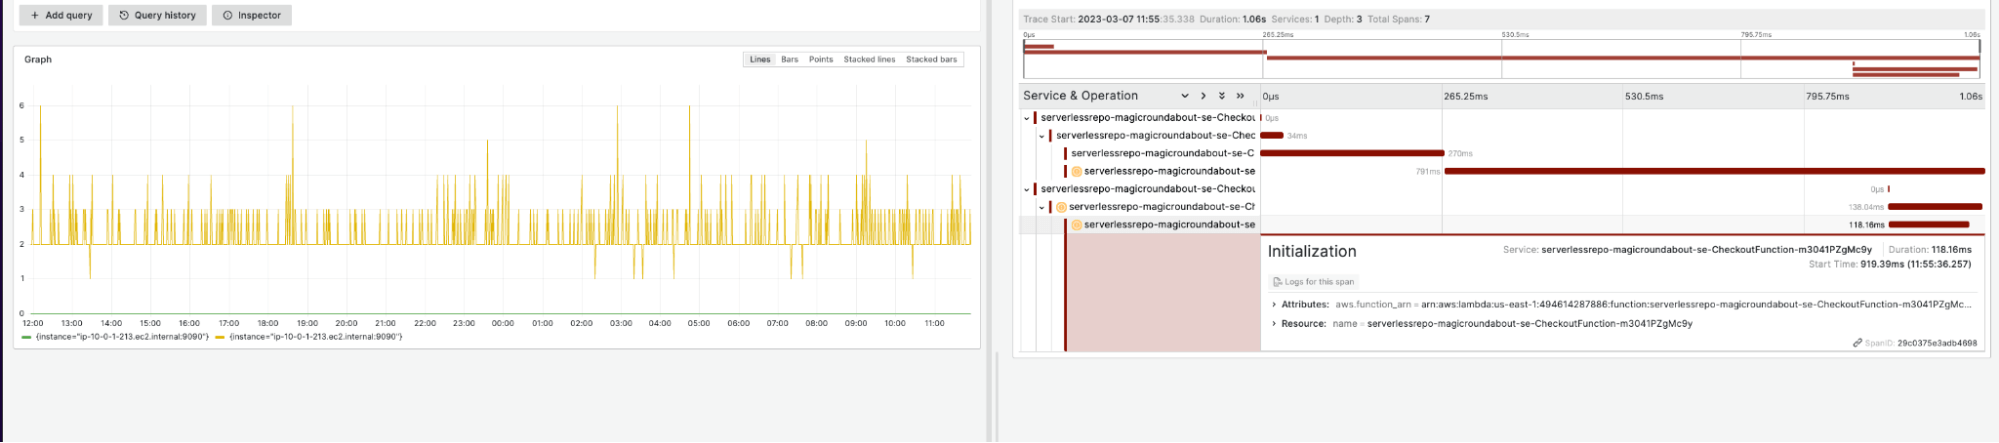
Service Correlation
Users can drill down into specific Fargate clusters that may be encountering problems and correlate that data with logs and metrics generated by other serverless services such as Lambda functions through matching labels and tags.
Users may check, for instance, which cluster pods are using the most CPU and whether the associated Lambda function is affected to quickly identify and isolate problems and root causes with a seamless, associated view of their surroundings.
* Dashboard images linked from the Grafana.com Blog
💡 Need More Metrics?
Grafana Agent, Vector and Telegraf can scrape Prometheus metric endpoints and write resulting timeseries directly to qryn through the Prometheus remote_write API
💡 Need More Logs?
Extend the Agents configuration to include logs or simply instrument your pods with Promtail to export any interesting log to qryn or qryn.cloud
Ready to get polyglot? Activate your setup today on qryn.cloud
⚡Powered by Gigapipe